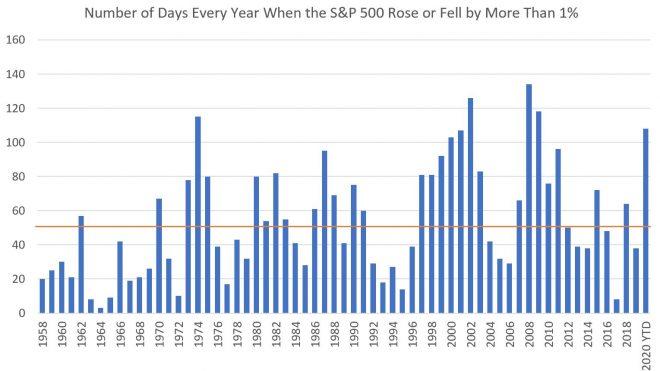
109 “1 Percent” Days So Far This Year: What 2020’s Equity Vol Says About December
Tyler Durden
Tue, 12/01/2020 – 20:45
By Jessica Rabe of DataTrek
The S&P 500 has moved more than 1 percent up or down on 108 trading days so far this year (109 with Tuesday’s 1.1% move), or almost half the time. That’s our fundamental benchmark of how much investors “feel” volatility, as any one-day move greater than 1 pct to the upside or downside is +1 standard deviation from the S&P’s mean daily return back to 1958. For reference, there is typically one +/-1 pct day/week in normal times. Here is an update for 2020’s count on a quarterly and annual basis:
- Q1 2020: 30 one percent days versus the Q1 average of 13 since 1958 (first full year of data).
- Q2 2020: 38 one percent days compared to the Q2 average of 13.
- Q3 2020: 21 one percent days versus the Q3 average of 13.
- Q4 2020 QTD through today: 19 one percent days versus the Q4 average of 14.
- 2020 YTD: 108 one percent days, more than double the whole-year average of 53 over the last 6 decades.
Bottom line: the S&P has only registered 100 or more “plus-one percent days” seven times including this year over the past +6 decades, or just 11 percent of the time. Therefore, we looked at what happens in December relative to returns and volatility amid these rare years of elevated equity market churn. Here are the results, clustered into 3 periods:
Period #1:
1974 (115 one percent days total, -25.9 pct total return):
- December: 10 one percent days, down -2.0 pct on a price basis
Comment: This disappointing performance came after another painful year (1973, S&P down 14.3 pct) amid the Saudi Oil Embargo and resultant energy crisis. Despite the Federal Reserve cutting rates in Q4 1974, the S&P still had elevated volatility (should be about 4 one percent days a month) and a negative performance that December. It was not until 1975 that volatility abated (80 one percent days) and the index rebounded 37 pct.
Period #2:
2000 (103 one percent days, -9.0 pct total return):
- December: 10 one percent days, up 0.4 pct
2001 (107 one percent days, -11.9 pct total return):
- December: 6 one percent days, up 0.8 pct
2002 (126 one percent days, -22.0 pct total return):
- December: 9 one percent days, down -6.0 pct
Comment: a slew of shocks that were both economic (Dot Com Bubble Burst) and geopolitical (domestic terror attack and international oil shock) created sharply negative returns and magnified volatility for three consecutive years in the early 2000s. While the S&P managed to end higher slightly in December 2000 and 2001, it had a rough December 2002 amid growing tensions with Iraq and a slow economic recovery from the 2001 recession. It took until 2003 (+28.4 pct total return and 83 one percent days) for volatility to trend lower and performance to start snapping back.
Period #3:
2008 (134 one percent days, -36.6 pct total return):
- December: 15 one percent days, up 0.8 pct
2009 (118 one percent days, +25.9 pct total return):
- December: 5 one percent days, up 1.8 pct
Comment: that unusually high number of one percent days in December 2008 contributed to the quarterly record of 50 in Q4 2008. That’s because the Federal government did not pass the landmark recovery bill for the Financial Crisis until February 2009, or one month before the market bottomed. Nevertheless, the S&P still had a positive return that December ahead of the change in power to end gridlock the next month in January 2009. The S&P also had a positive return in December 2009 after an especially volatile year as the Fed cut rates.
Bottom line: 4 out of the 6 years with especially volatile returns (+100 one percent days) saw the S&P have a positive performance in December with still mostly above average number of one percent days for the month. That’s a small sample size, however, so the greater message is that a series of both economic and geopolitical shocks usually lead to weak performance in December during these types of years (i.e. 1974 and 2002). While we recognize valuations – like in the early 2000s – are lofty, we think the current dynamic most mirrors the 2008/2009 experience. Yes, there was no pandemic back then, but there are finally highly effective vaccines on the way. Additionally, the Fed remains accommodative, and even if lawmakers can’t come to an agreement on a CARES Act II as they return to Congress, President-elect Joe Biden has the opportunity after he is Inaugurated in January.
That said, with the S&P already up double digits for the year (+12.1 pct), we understand why some investors want to lighten up. History shows that even if the S&P is usually positive during December in particularly volatile years like 2020, returns are mostly mild (+0.4 pct to +1.8 pct). But for those still bullish, the data is in your favor for a little more upside to end the year.
