“A Year Like No Other”: 20 Charts Showing The Insanity Unleashed By Central Banks
Tyler Durden
Fri, 12/18/2020 – 15:45
“It all happened in five weeks.”
That’s the beginning of the annual recap note published by Goldman’s chief credit strategist Lotfi Karoui, and it summarizes perfectly the period between March and May 2020 in which we saw “a faster drawdown and recovery than 2008/2009.” Alas, said record recovery came at a price: the nationalization of bond markets by central banks. So to commemorate what he says has been “a year like no other”, Karoui has put together 20 charts showing the absolute insanity unleashed by central banks in credit markets in 2020 in order to avert the collapse of financial markets – and civilization – as we know them.
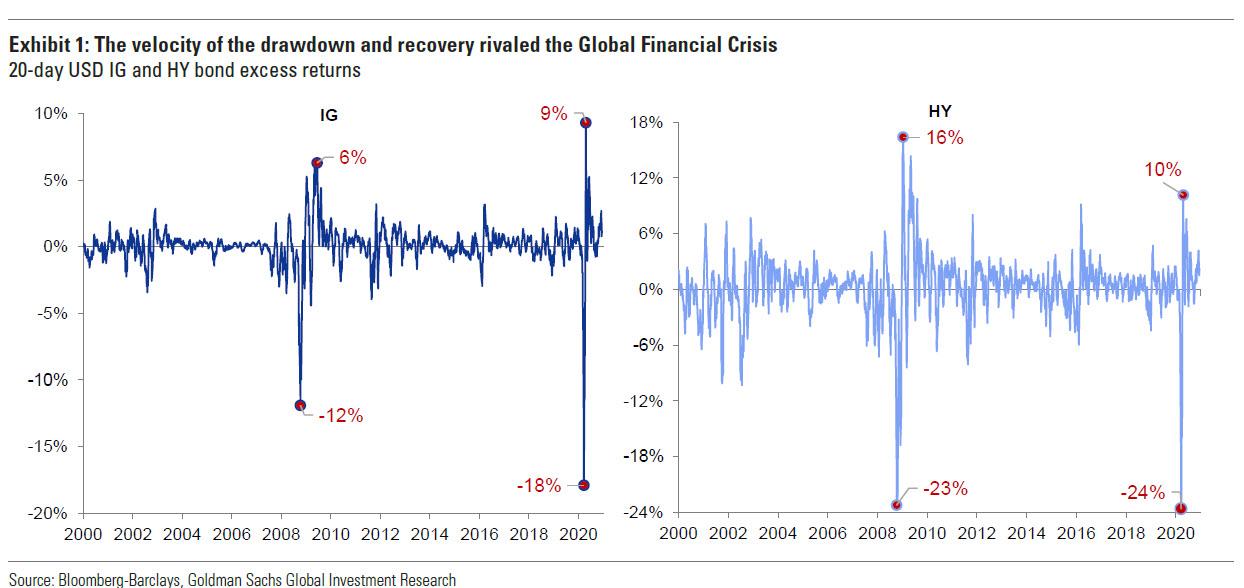
1. The biggest rollercoaster in history: The sudden stop in global economic activity and the subsequent policy response sparked the fastest drawdown and recovery in the three-decade history of the USD corporate bond market. This is illustrated in Exhibit 1, which plots the 20-day excess returns on IG and HY cash indices since 2000. While spreads peaked at tighter levels relative to the Global Financial Crisis, the velocity and the magnitude of the downward move was quite comparable, particularly in IG. And owing to the strong policy response (both on the fiscal and monetary fronts), the speed of the recovery was even faster than in the aftermath of the Global Financial Crisis. Since the Fed’s announcement of the Corporate Credit Facilities on March 23, the IG and HY bond markets have rewarded investors with cumulative excess returns to Treasuries of 20% and 28%, respectively
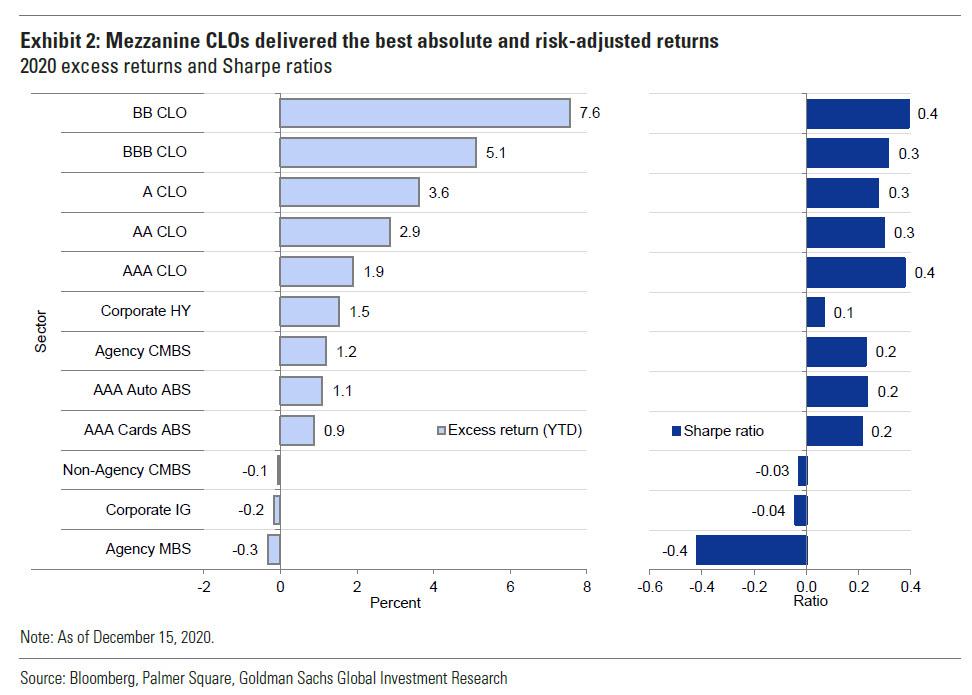
2. CLOs delivered the best absolute and risk-adjusted returns… Within the broader fixed income universe, 2020 saw CLO IG-rated and mezzanine tranches outperform corporate bonds and other structured products on an absolute basis. As shown in the left panel of Exhibit 2, BB-rated and BBB-rated CLOs achieved 7.6% and 5.1% returns in excess of 3-month LIBOR, respectively, year-to-date. This compares to 1.5% and -0.2% for HY and IG corporate bond excess returns to Treasuries. When performance is expressed on a risk-adjusted (i.e. Sharpe ratio) basis, BB-rated and BBB-rated CLOs still score the highest (right panel of Exhibit 2). AAA-rated CLOs and AAA-rated consumer ABS also performed well on a risk-adjusted basis in 2020, even if nominal unlevered returns were relatively modest.
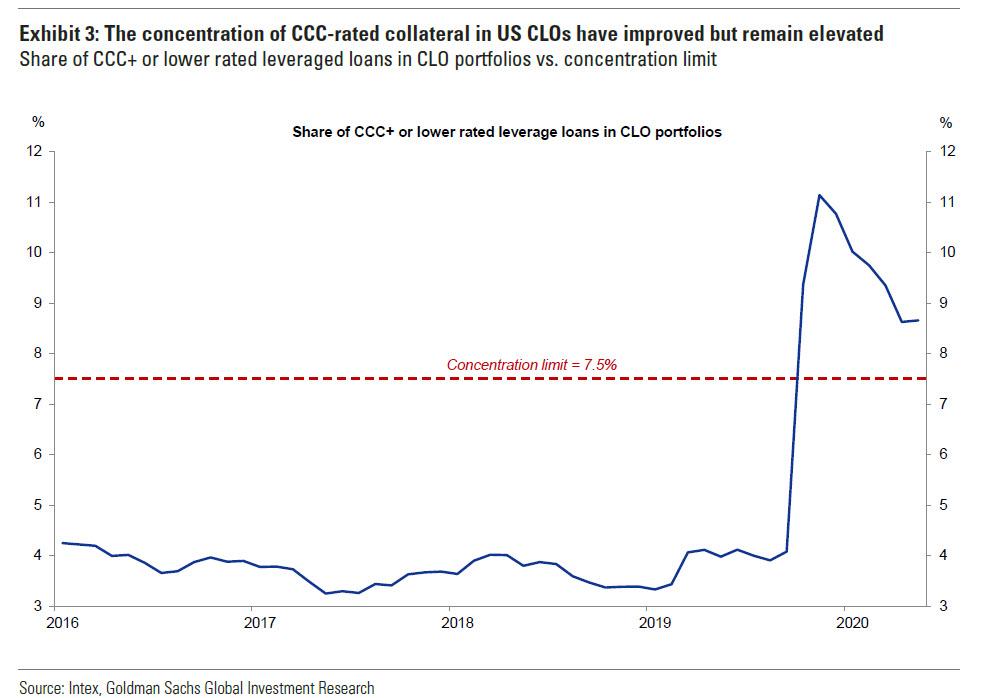
3. … despite reaching their CCC concentration limit. The outperformance of CLOs is quite impressive considering the fact that the share of CCC-rated leveraged loans remains above the common limit of 7.5%; a trigger rule that could require CLO managers to divert the cash flows from loan payments to more senior tranches (Exhibit 3). A wave of leveraged loan downgrades at the outset of the economic shutdown in March sent CCC concentrations to a peak of 11% in May. But since then, the trend has been improving as CLO managers took advantage of the normalization in market liquidity conditions to improve the quality of their assets. Thus far, the trigger rules have only impacted equity tranche investors, leaving higher rated tranches attractive to investors.
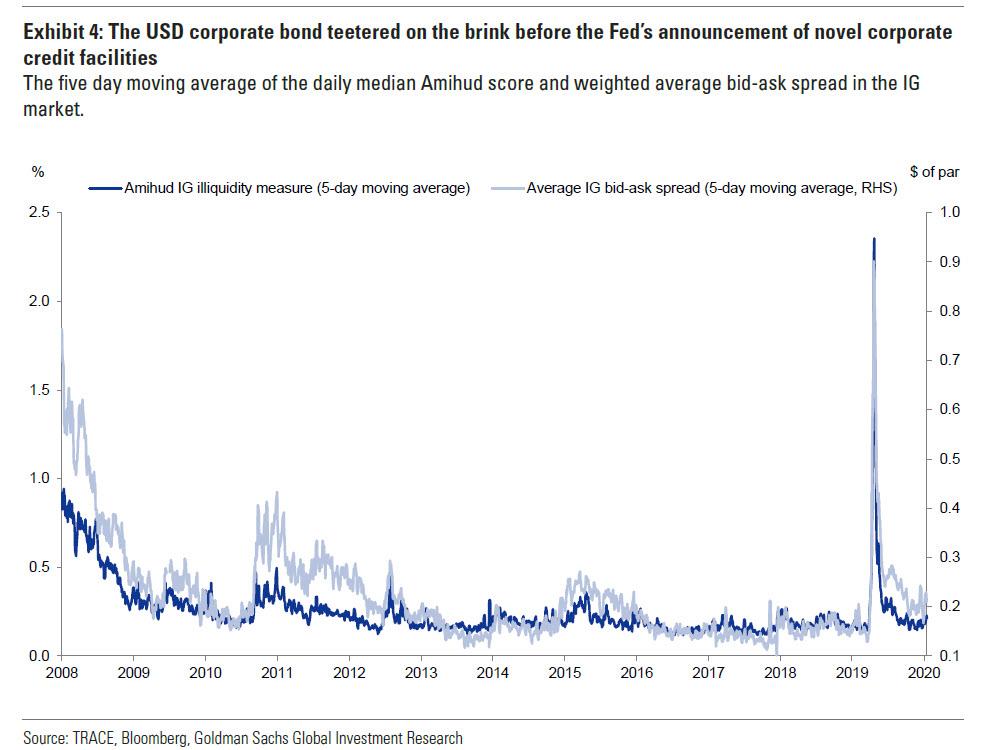
4. The pandemic pushed market microstructure to the brink of collapse. At the height of the COVID-19 pandemic, the USD corporate bond market teetered on the brink of collapse as liquidity dried up faster and more severely than it had during the Global Financial Crisis. Exhibit 4 shows just how dramatic these moves were using both Amihud scores and bid-ask spreads. In just a few short weeks we went from a well-functioning and relatively liquid market, to the exact opposite as we entered non-linear territory. Then came March 23, the day the Federal Reserve announced its novel Corporate Credit Facilities, and just as fast as liquidity had dried up, it returned as Exhibit 4 highlights.
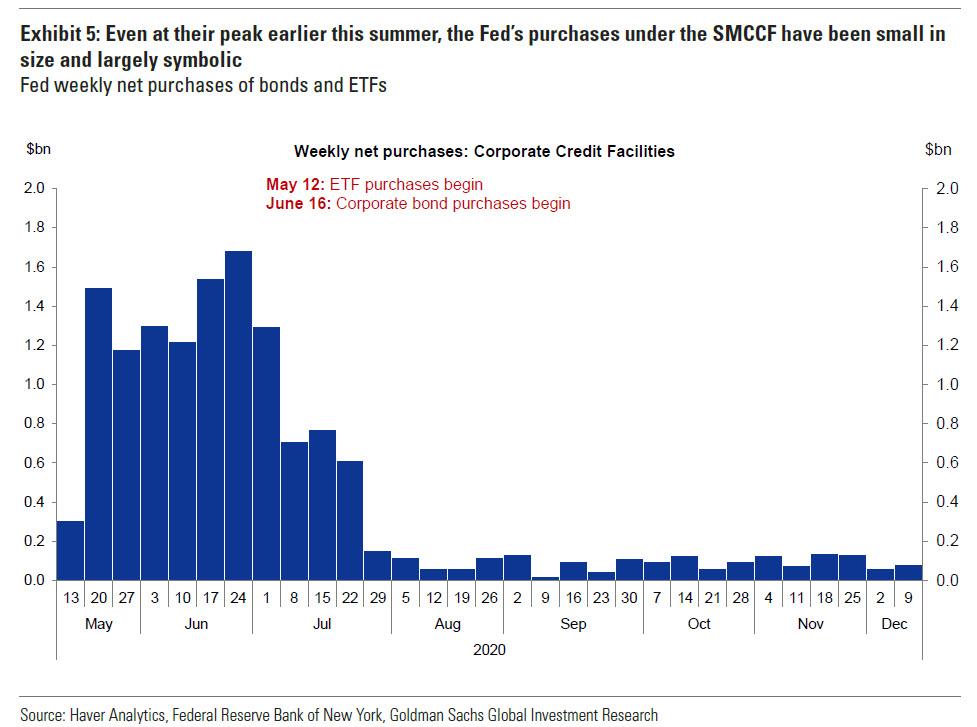
5. The Fed delivered a spectacular announcement effect (and bought a few bonds too). The Fed’s announcement also catalyzed a swift recovery of the new issue market – especially in HY, where activity had been paused for a few weeks in March. But the Fed’s flow of purchases has been largely symbolic – consistent with a lender of last resort posture. Since SMCCF buying started in mid-May, just $14 billion of bonds and ETFs have been purchased on a combined, cumulative basis (Exhibit 5). To put this amount in context: the size of the USD IG market is more than $8 trillion while the SMCCF eligible universe has a total face value of $1.9 trillion (and $520 billion when applying the SMCCF program purchase limits, such as issuer constraints). In recent months, the amount of SMCCF purchases has been especially light, as the program nears its expiration at year-end 2020, following the return of the CARES Act funds (again, Exhibit 5).
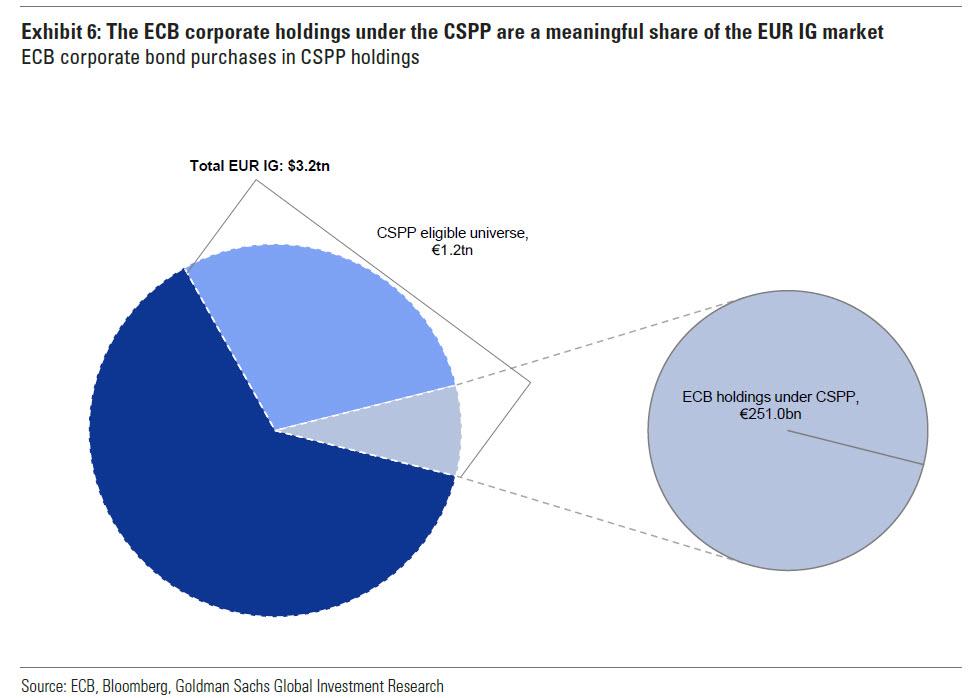
6. ECB now owns 8.5% of the EUR IG market. In the Euro area, the ECB continued to deploy its balance sheet in the corporate bond market, growing the size of its portfolio to €272 billion, €251 billion under the CSPP and an additional €21 billion under the PEPP. This compares to €185 billion at the start of the year. The ECB currently owns 23% of the eligible universe of securities and 8.5% of the broader universe of EUR IG corporate bonds outstanding (Exhibit 6). Over the past few months, the monthly flow of purchases has averaged €6 billion (mostly under the CSPP); enough to absorb a significant share of net issuance. With the bond purchases set to continue until at least March of 2022 or “for as long as necessary to reinforce the accommodative impact of its policy rates, and to end shortly before it starts raising the key ECB interest rates”, the ECB’s growing presence in the market remains a strong demand tailwind.
7. A record-high level for EUR IG bonds with negative yields. As of December 15, 41% of the EUR IG iBoxx index yields in sub-zero territory; a level that matches the previous record in August 2019 (Exhibit 7). Even more impressive is the fact that more than 10% of the index now yields below -0.25%. Negative yields are likely remain a fixture of the EUR IG corporate bond market in 2021, even if bund bond yields back up in response to solid growth next year. Combined with the decent demand tailwind from ECB purchases, this would keep search for yield motives strong.

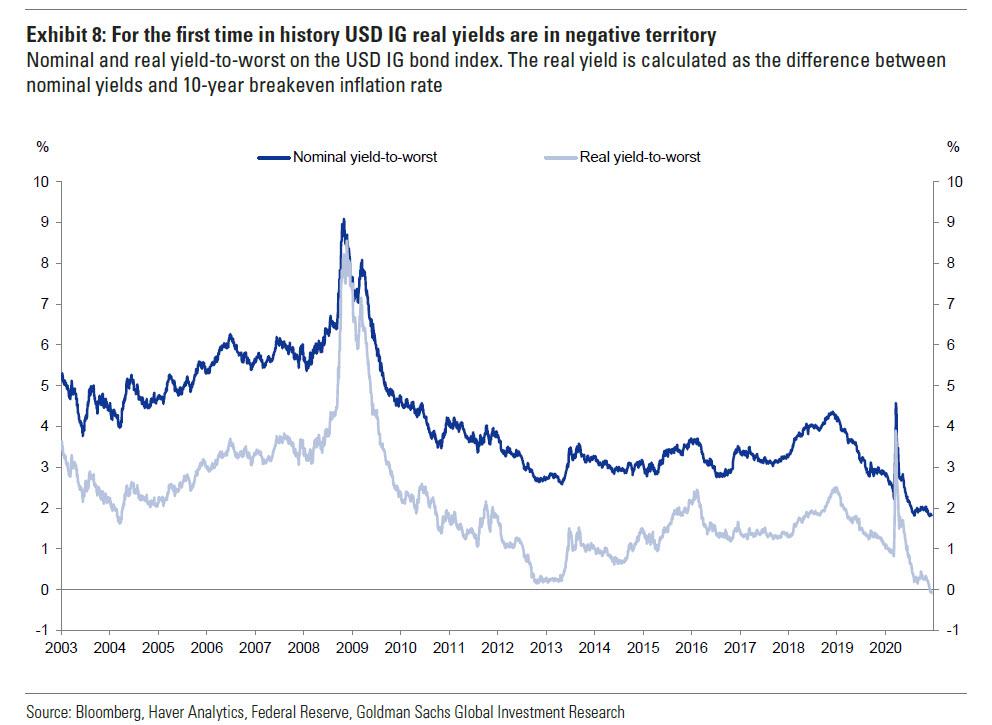
8. A first time for everything; USD IG real yields have turned negative. While most of the focus on negative yielding corporate debt has been concentrated on nominal yields in the EUR IG market, real yields on USD IG corporate debt have also turned negative for the first time in history (Exhibit 8). While Goldman economists don’t view a substantial uptick in inflation as an imminent risk, negative real yields have nonetheless increased the risk that a moderate inflation surprise could prove challenging for all-in yield-based buyers. These negative real yields should strengthen the bid for high carry instruments.
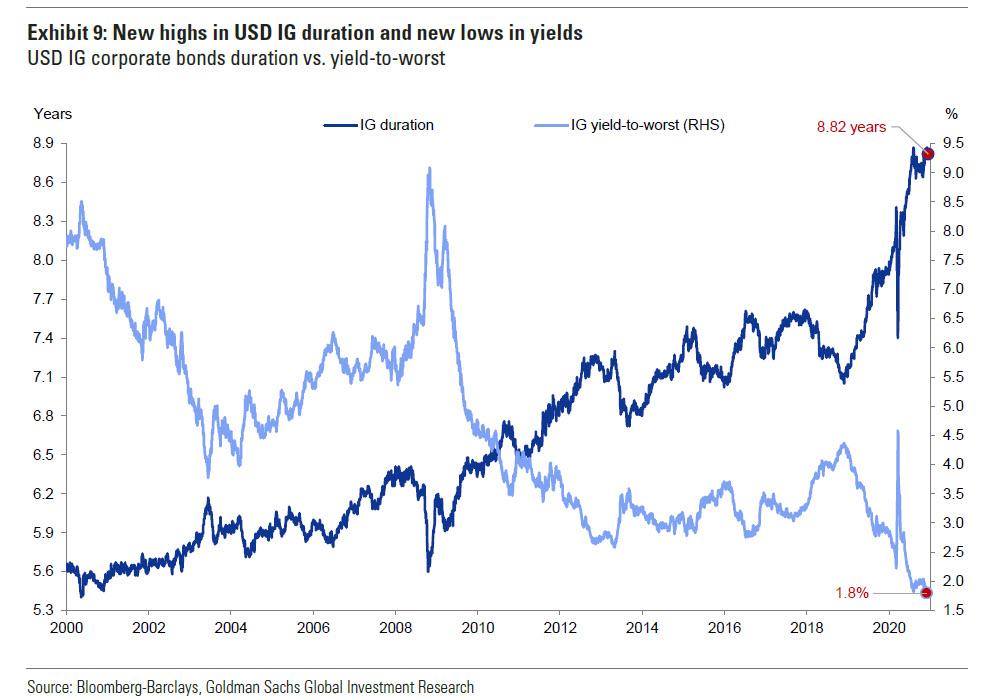
9. USD IG: New highs in duration; new lows in yields. 2020 saw the average duration of the USD IG market materially increase, further extending a trend that started in late 2018 (Exhibit 9). This increase reflects the proactive behavior of corporate borrowers which have been taking advantage of low yields and strong investor appetite to bolster their liquidity positions and extend the duration profile of their liabilities. The flipside of this tailwind for issuers has been a notable increase in the risk profile of IG portfolios. While the combined effect of longer duration, low yields (again Exhibit 9), and tight spreads does create vulnerabilities for corporate bond portfolios, Goldman thinks relatively anchored yields in 2021 coupled with low volatility should provide decent offsets.
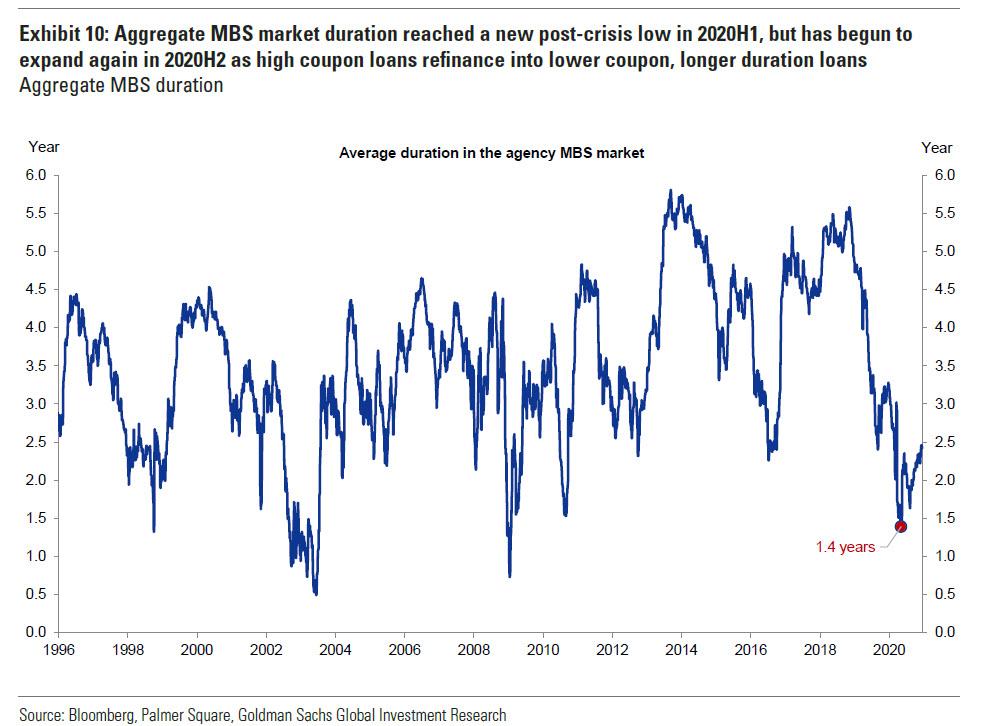
10. Agency MBS aggregate duration reached post-crisis low in 2020, starting to move back up. The aggregate duration of the agency MBS market reached a post-crisis low of 1.4 years in May, down from 5.5 years as of year-end 2018, as declining mortgage rates led to an anticipation of rapid prepayments and short remaining mortgage lifetimes. However, over the past few months, MBS duration has extended again, and is now back up to 2.5 years (Exhibit 10). This recent extension of duration has been driven by potential prepayments converting into actual, realized prepayments, with borrowers from high coupon pools refinancing into new, lower coupon, longer duration pools. For context, 1.5% coupon MBS have a duration above 6.5 years, and the share of 1.5s and 2.0s among outstanding 30-year MBS has grown from 0% at the start of the year to 17% as of December.
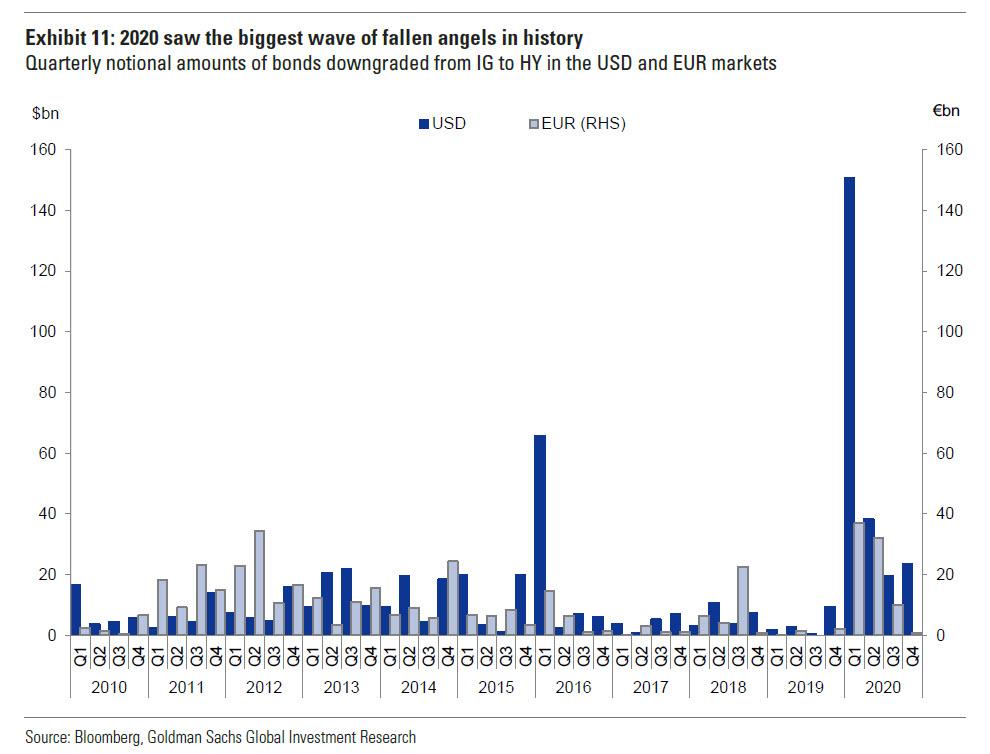
11. Record-high volumes for fallen angels in 1Q... After several years of rising stars outpacing fallen angels, 2020 reversed course and set new all-time records for fallen angel downgrades (Exhibit 11). The notional amount of debt downgraded from USD IG to USD HY in the first quarter easily surpassed the previous all-time record, reaching just over $150 billion. Another $81 billion of fallen angels were downgraded in the subsequent three quarters of the year. In the EUR market, a similar dynamic emerged with fallen angel volumes reaching nearly €37 billion in the first quarter; another €43 billion was added over the subsequent three quarters. For 2021, we forecast just $30 billion of net rating migrations into the USD HY market: $80 billion of fallen angels, partially offset by $50 billion of rising stars. This compares to more than $200 billion of net rating migration into HY, so far in 2020.
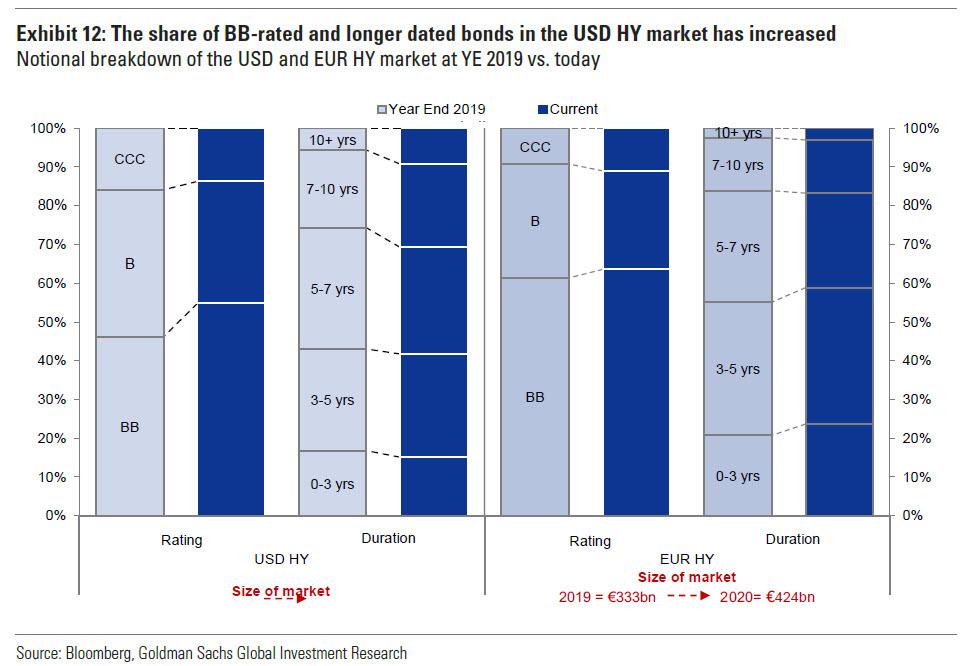
12. …that increased the size, improved the quality and extended the duration of the USD and EUR HY markets. The wave of fallen angel downgrades coupled with the deluge of issuance and the uptick in defaults has shifted the composition of the HY market in three ways. First, the size of the USD market grew by 20% to $1.55 trillion of face value outstanding from $1.29 trillion in year-end 2019. Second, the average quality has improved, with the share of BB-rated bonds increasing from 46% of the index to 55% (left panel of Exhibit 12). Third, the market’s average duration moved higher as fallen angels increased the share of long-dated bonds (again, Exhibit 12). The same trend prevailed in the EUR HY market in terms of size and quality. The size of the market grew by 27%, to €424 billion of total face value from €333 billion in year-end 2019. BB-rated bonds also grew their share to 64% from 61% in year-end 2019. But in contrast to the USD HY market, the EUR HY universe the duration composition has moved in the opposite direction, the share of short-dated bonds increasing to 24% from 21% in year-end 2019, while the share of long-dated bonds declined to 24% from 29%, over the same period (right panel of Exhibit 12).
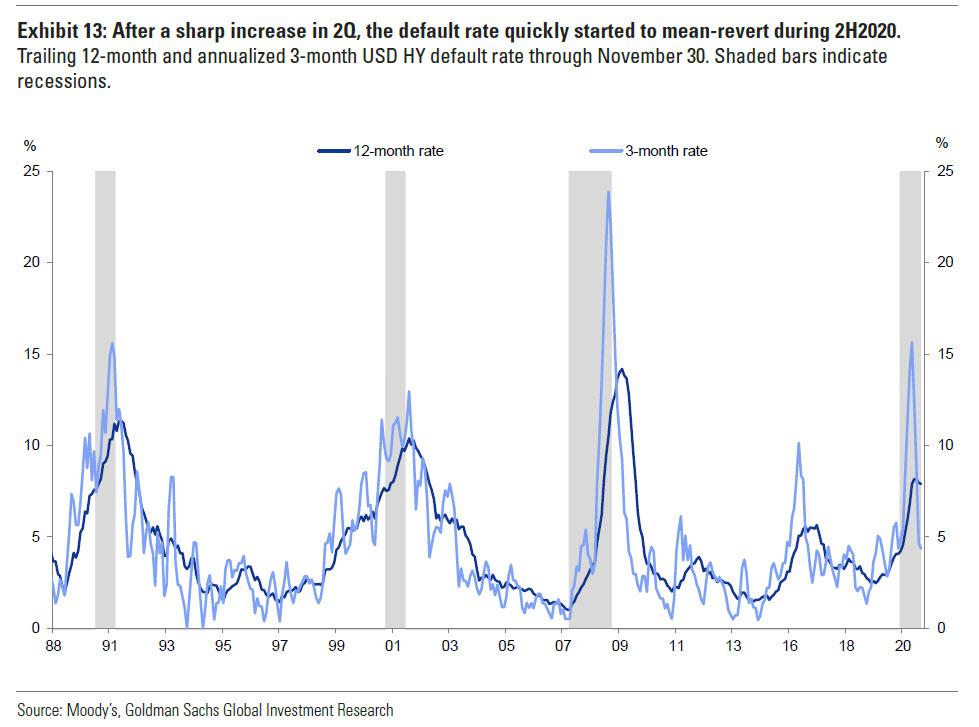
13. The COVID default cycle has been the most benign in three decades. After peaking during the second quarter, the pace of defaults has quickly reverted towards its long-run historical average of 4% over the second half of the year. To put the speed of this reversal into context, Exhibit 13 shows both the 12-month and annualized 3-month tailing default rates. While the 12-month rate continues to appear elevated by historical standards, the faster-moving 3-month rate has now dipped below 5% on annualized basis. While the risk of a second wave of defaults isn’t negligible, Goldman thinks the bar is quite high given that many of the weakest firms, a.k.a. zombie firms, have already defaulted. Further, record-high issuance has strengthened balance sheet liquidity positions (more below), thus rendering default incentives quite low, in our view.
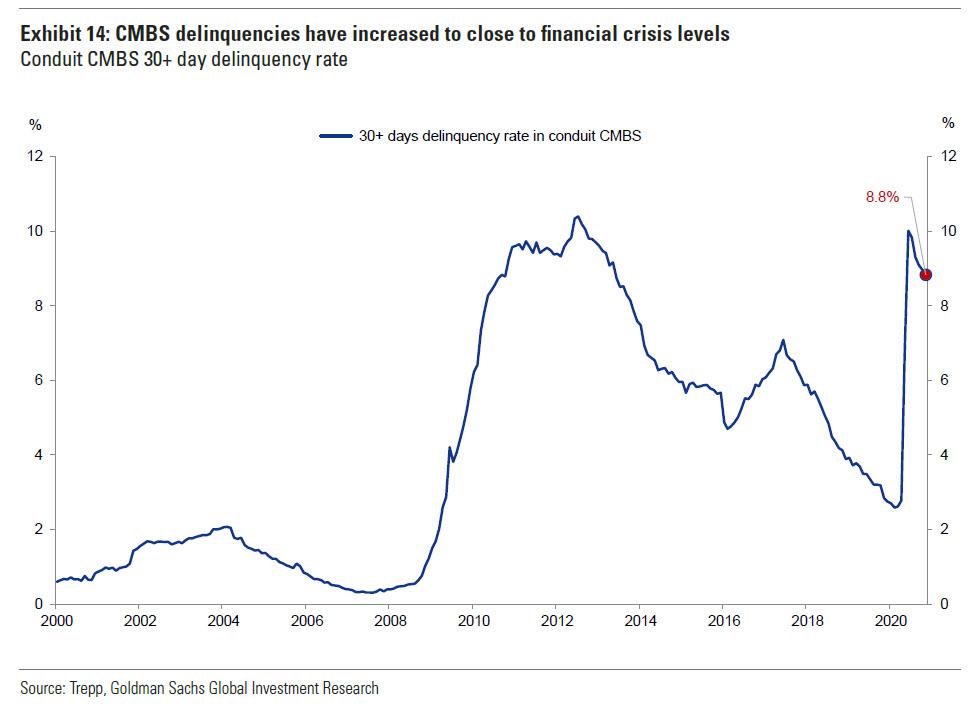
14. CMBS delinquencies revisited the 2009 highs. As of the end of November, conduit CMBS delinquency rates remain close to the peak reached during the Global Financial Crisis (Exhibit 14). Stress continues to be concentrated in sectors directly disrupted by the virus: delinquency rates for hotel property types are just under 23%, followed by retail property types at 12%. Despite delinquency rates on par with those from the Global Financial Crisis, these elevated delinquency rates may not translate to losses of the same magnitude. For example, thus far, declines in property prices have been relatively limited at less than 5% for most major property types, once again thanks to Fed intervention. Further weakness is likely but Goldman expects price declines to be limited to ~10%.
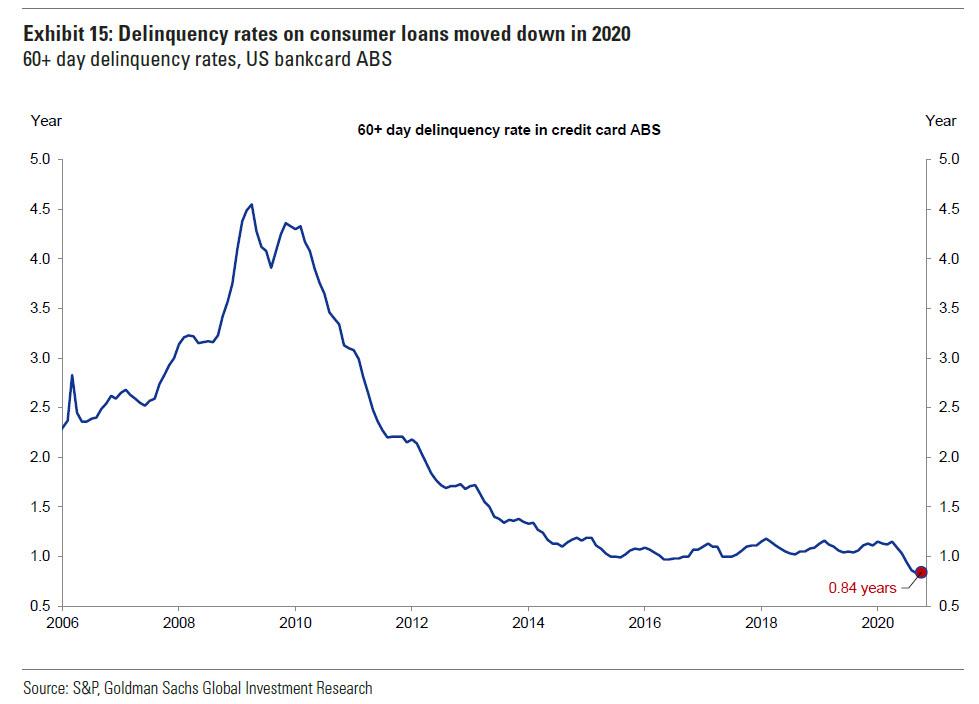
15. But consumer loan delinquency rates moved to new lows in 2020. Despite the severity of the downturn, consumer delinquency rates moved down on the year (Exhibit 15). This resilience partly reflects the generous fiscal support made available during the deepest periods of stress in 2020; the forbearance and other loan modification programs offered by servicers also helped keep borrowers out of delinquency status. Delinquency rates will likely move up somewhat in 1H2021 as forbearance programs expire, but we think performance will settle back close to 2019 levels by 2021 year-end.
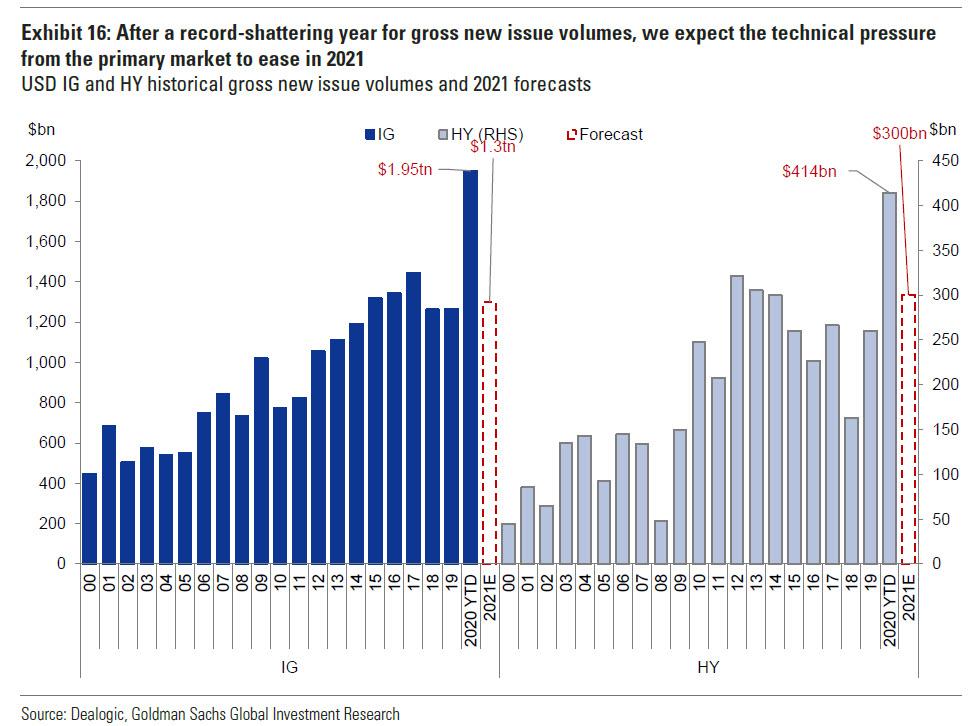
16. Record-high issuance in the USD market… 2020 generated record-shattering gross new issue volumes in USD corporate bond markets: $1.95 trillion in IG and $414 billion HY (Exhibit 16). Even HY-rated firms in sectors at the epicenter of the COVID-19 disruption were able to tap the public markets for debt funding – sometimes multiple times in a span of months. For 2021, Goldman forecasts gross USD IG supply of $1.3 trillion, and $300 billion for the USD HY market. These estimates represent notable declines (in the range of 25% to 30%) relative to 2020, implying that the technical pressure from the primary market should ease next year. That said, Goldman forecasts are towards the high-end of the post-crisis range, as attractive debt funding costs will likely continue to give management teams incentive to issue opportunistically.
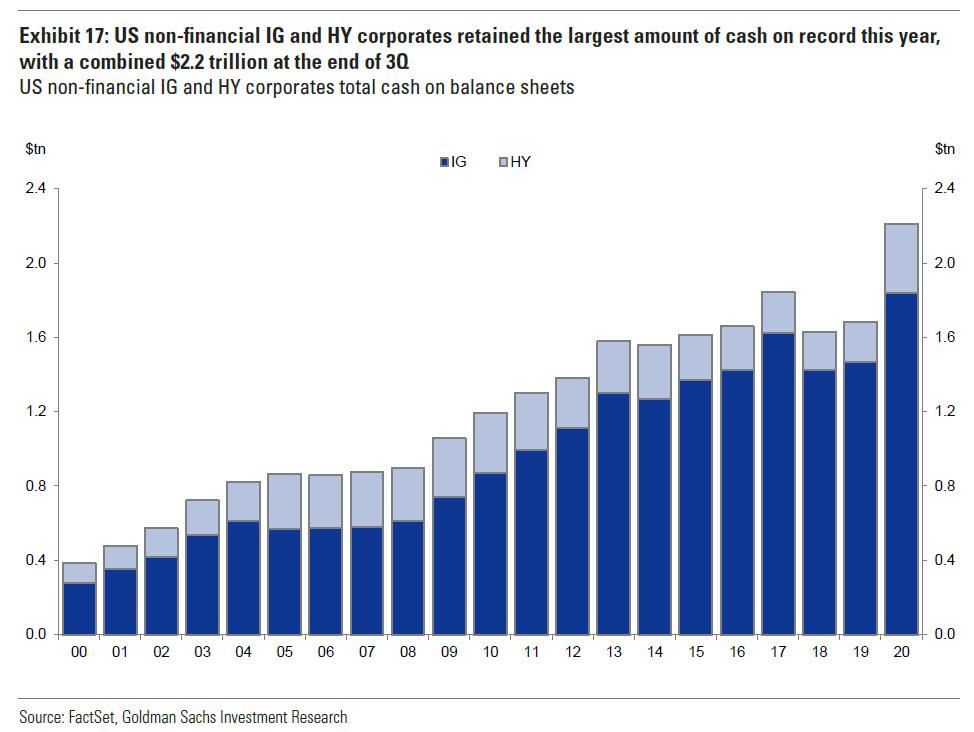
17. …fueling a material increase in balance sheet liquidity. Record-high issuance has fueled a significant increase in the amount of cash on US non-financial corporate balance sheets. HY-rated firms, in particular, increased their amount of cash on hand by 73% this year vs. year-end 2019—though we note when excluding this year’s cohort of fallen angels this increase is 33%. Non-financial IG-rated corporations, on the other hand, retained $1.8 trillion in cash, netting a 25% improvement. As the economic environment improves in 2021, keep an eye on how firms deploy this excess cash, especially signs of a premature return to active forms of re-leveraging.
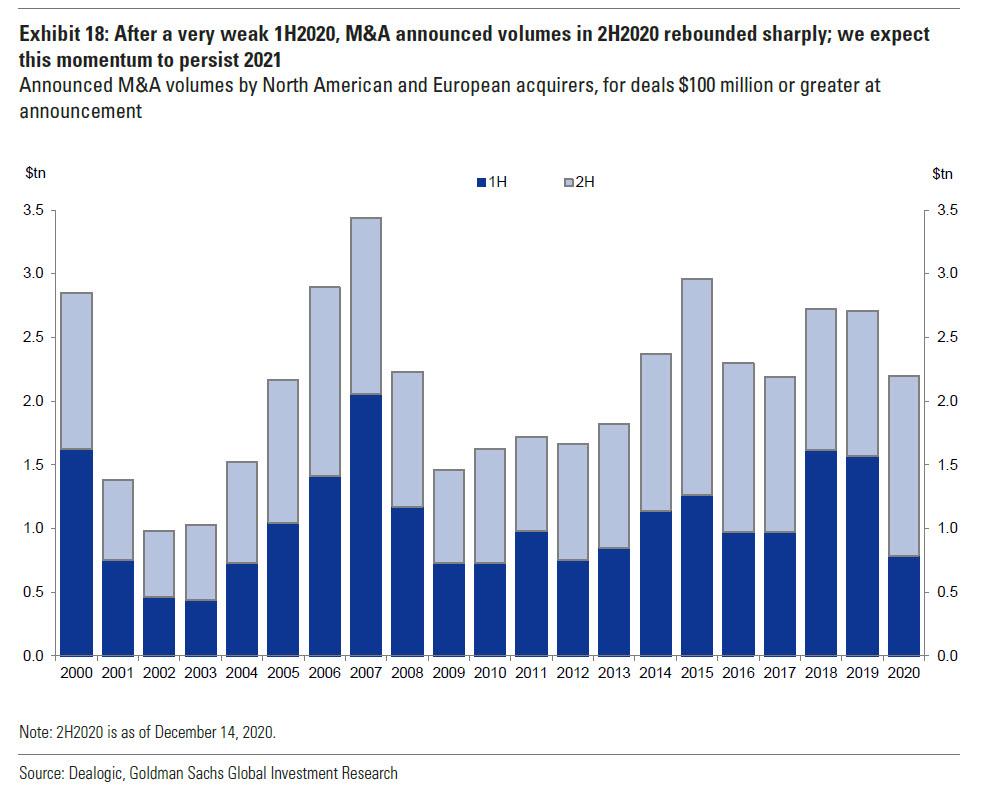
18. A V-shaped recovery in M&A activity. A strong uptick in debt-funded M&A is one active form of re-leveraging that we will keep an eye on in 2021. As optimism around the vaccine timeline and cyclical recovery emerged in the summer, firms shifted from defense to offense on the M&A front. 3Q2020 announced M&A volumes represented a sharp V-shaped recovery from the weak 2Q2020 levels, driven in part by cash-rich sectors such as Technology and Healthcare (Exhibit 18). Goldman expects M&A activity to remain elevated in 2021, driven by well-capitalized strategic buyers’ desire to diversify their business models and gain scale – especially in light of the COVID-19 disruption. Sponsors also have significant flexibility, with record amounts of dry powder available. Of course, the ultimate implications for credit quality will depend on the financing trends of future M&A activity.
19. A blockbuster year for ESG issuance. 2020 has been a strong year for ESG supply with the USD IG market increasing overall ESG issuance by 35% to just over $60 billion, while the EUR IG market was also able to sustain its high level of ESG issuance, clocking in at around €60 billion (Exhibit 19). Within the various types of ESG issues, those flagged for “social” causes had the fastest growth in the USD IG market at 100% year-over-year ($4 billion vs. $8 billion), driven by both pandemic aid-related and racial injustice issues.
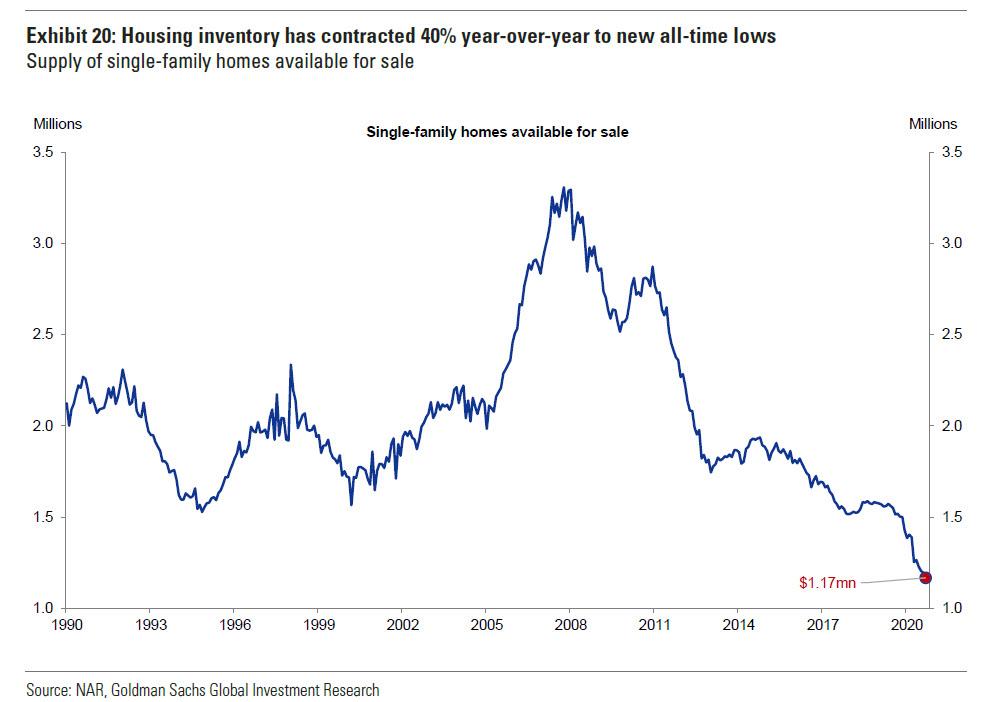
20. No recession for the housing market. Despite the severity of the recession, the U.S. National Case-Shiller Home Price Index suggests that home prices are currently growing at a >15% annual pace. This strong growth reflects a supply-demand imbalance. Pending home sales and existing home sales currently sit at levels up 20% year-over-year. On the supply side, the number of single-family homes available for sale has fallen by nearly 40% in 2020 to its lowest level in two decades (Exhibit 20). Goldman believes that housing demand will remain robust in 2021, driven by low mortgage rates and strong demographic demand; the bank also expects mortgage rates to inch up from current levels to 2.9% by YE2021, and forecasts house price growth will reach 3.7% across the U.S. in 2021.