Charts That MaKe Black Swans
As the Federal Reserve begins what will most likely be a short lived series of rate hikes, the effects of anticipation begin.
For the Fed the greatest challange is containing volatility—unless volatility allows for 13(3)(unusual and exigent circumstances). Inflation is not as problematic as most financial experts—who have rekindled a fondness for the middle class and poor—believe. That’s why the Fed will stick with 50bp hikes and may begin warning of future economic weakness and lower inflation expectations in the coming months. Their slower than expected rate increases will come about due to an economy deteriorating faster than expected.
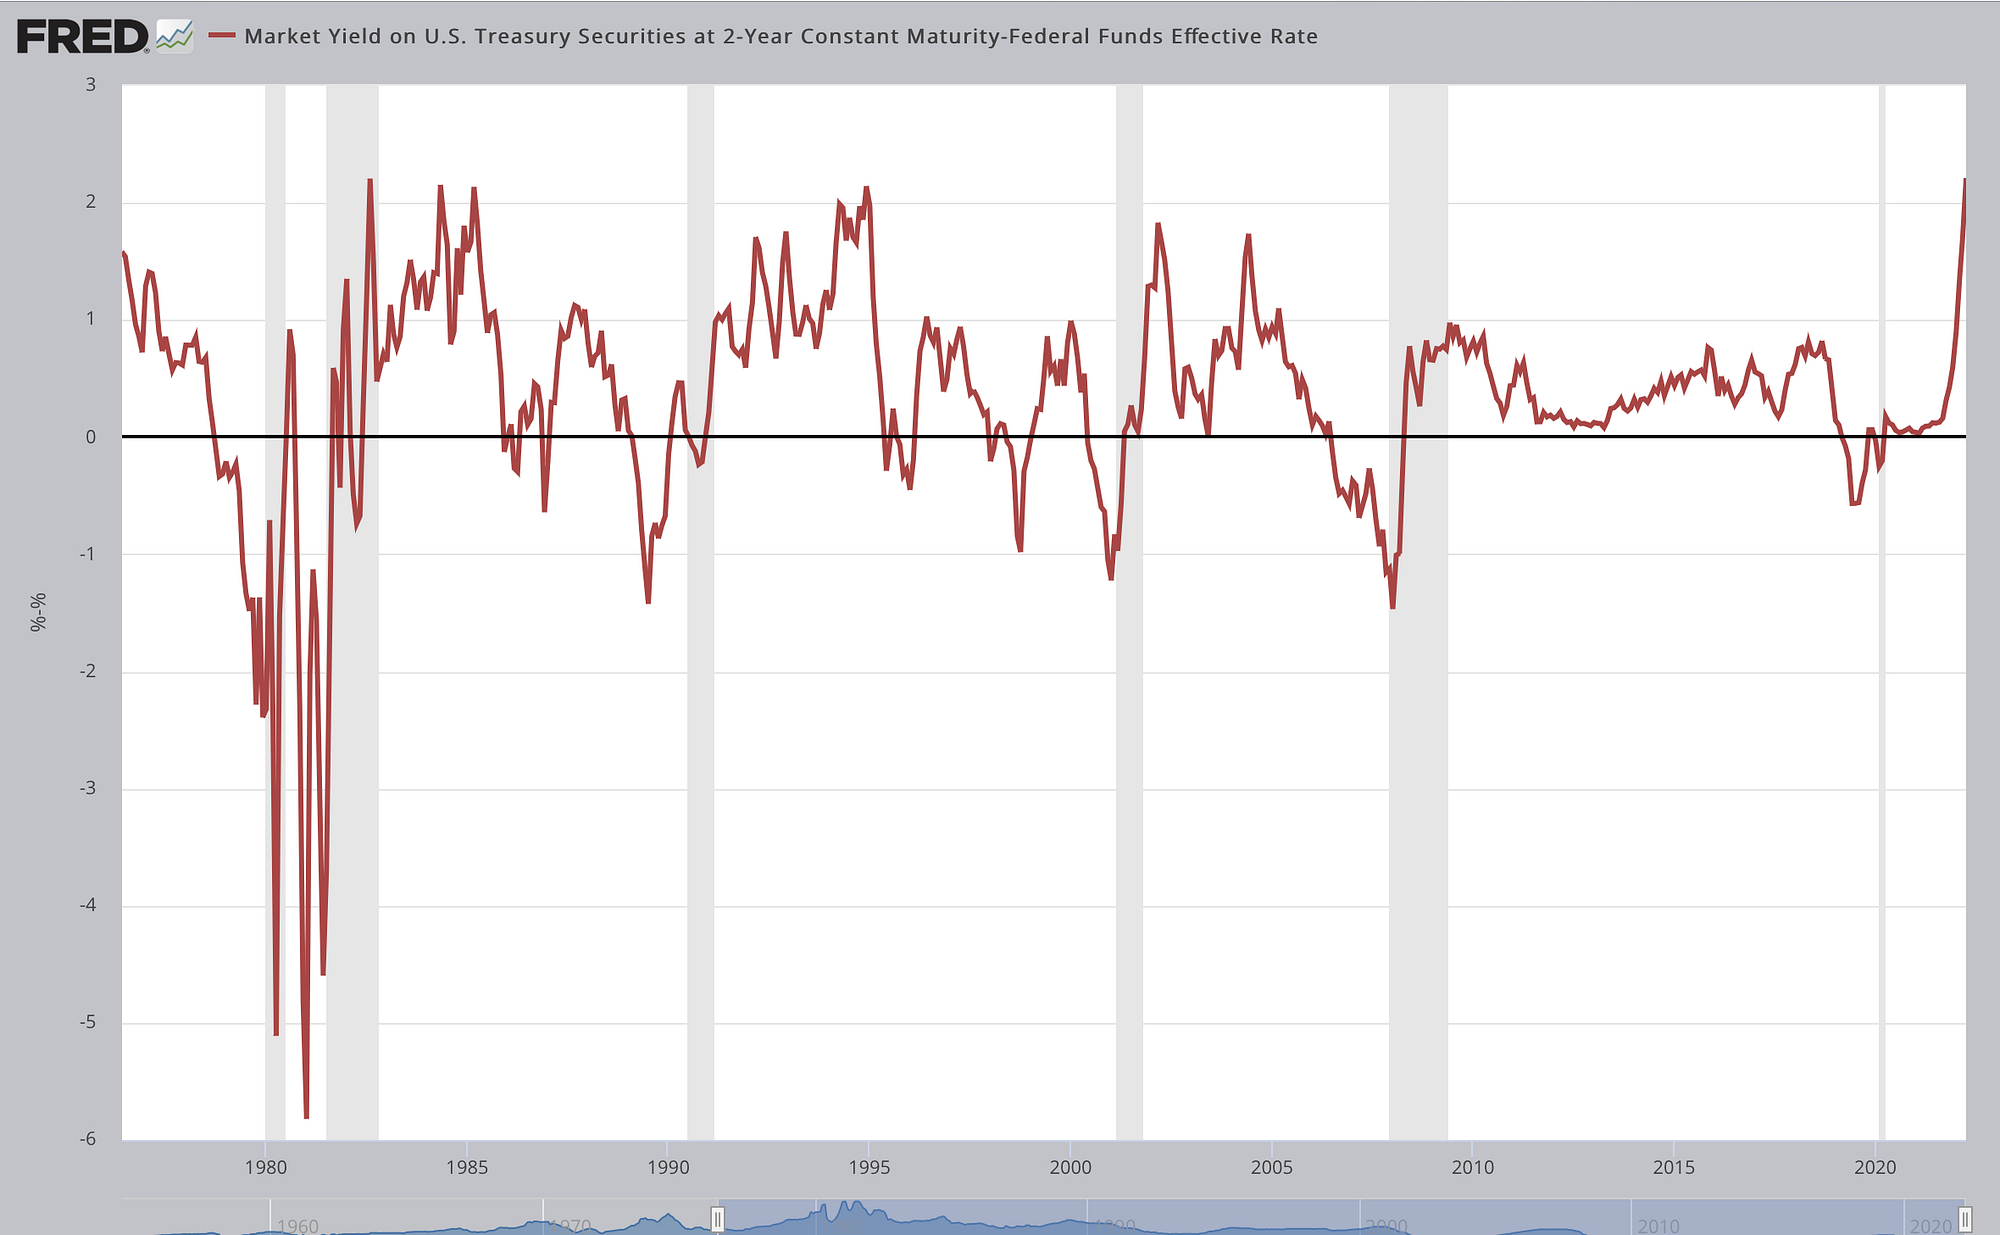
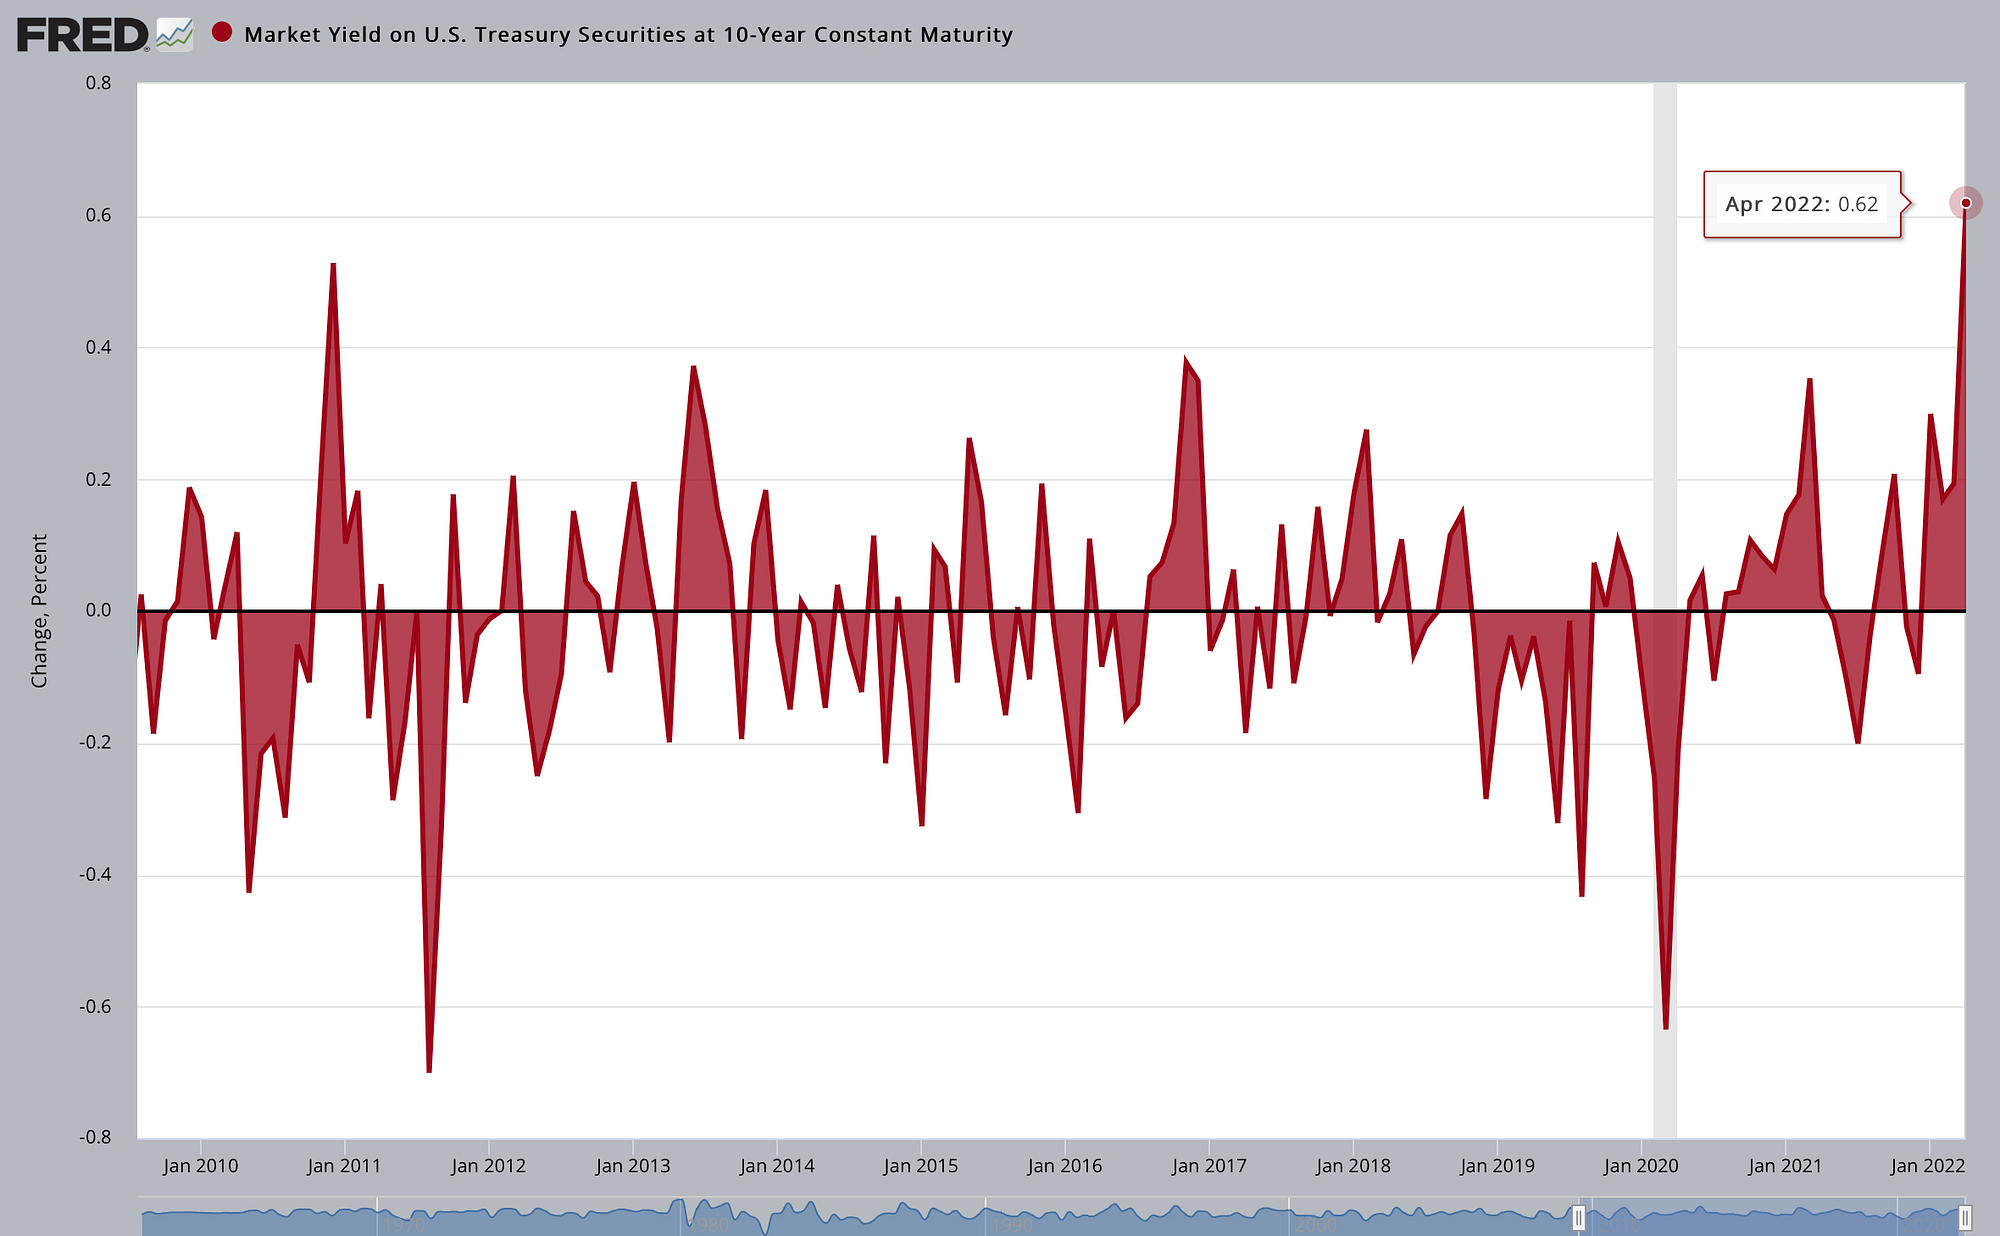
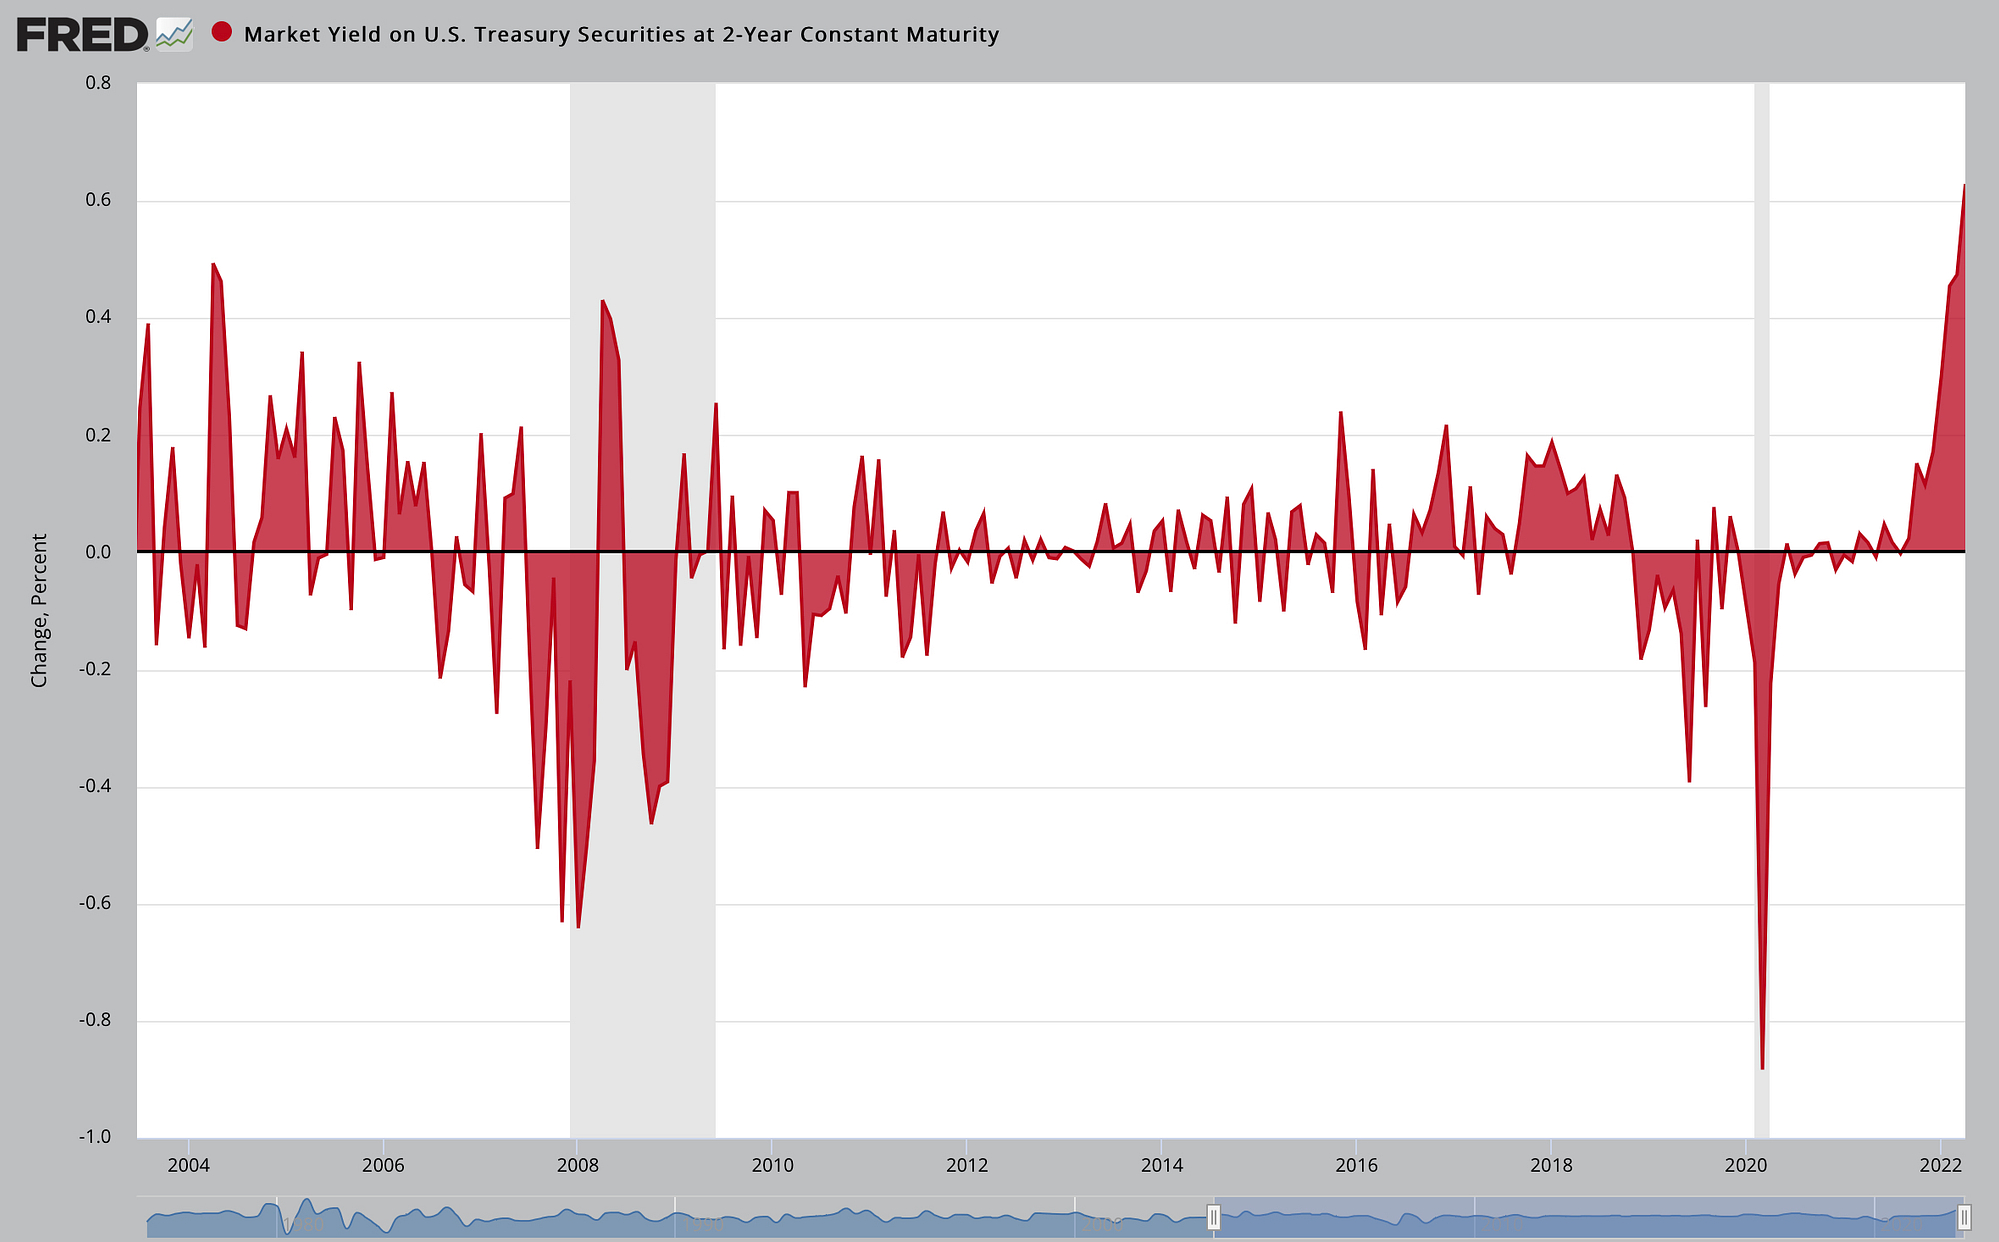
TREASURY & BOND MARKET


Housing


commercial banks


Commodities
Each chart is accompanied by its Price Rate of Change to exemplify current volatility.


