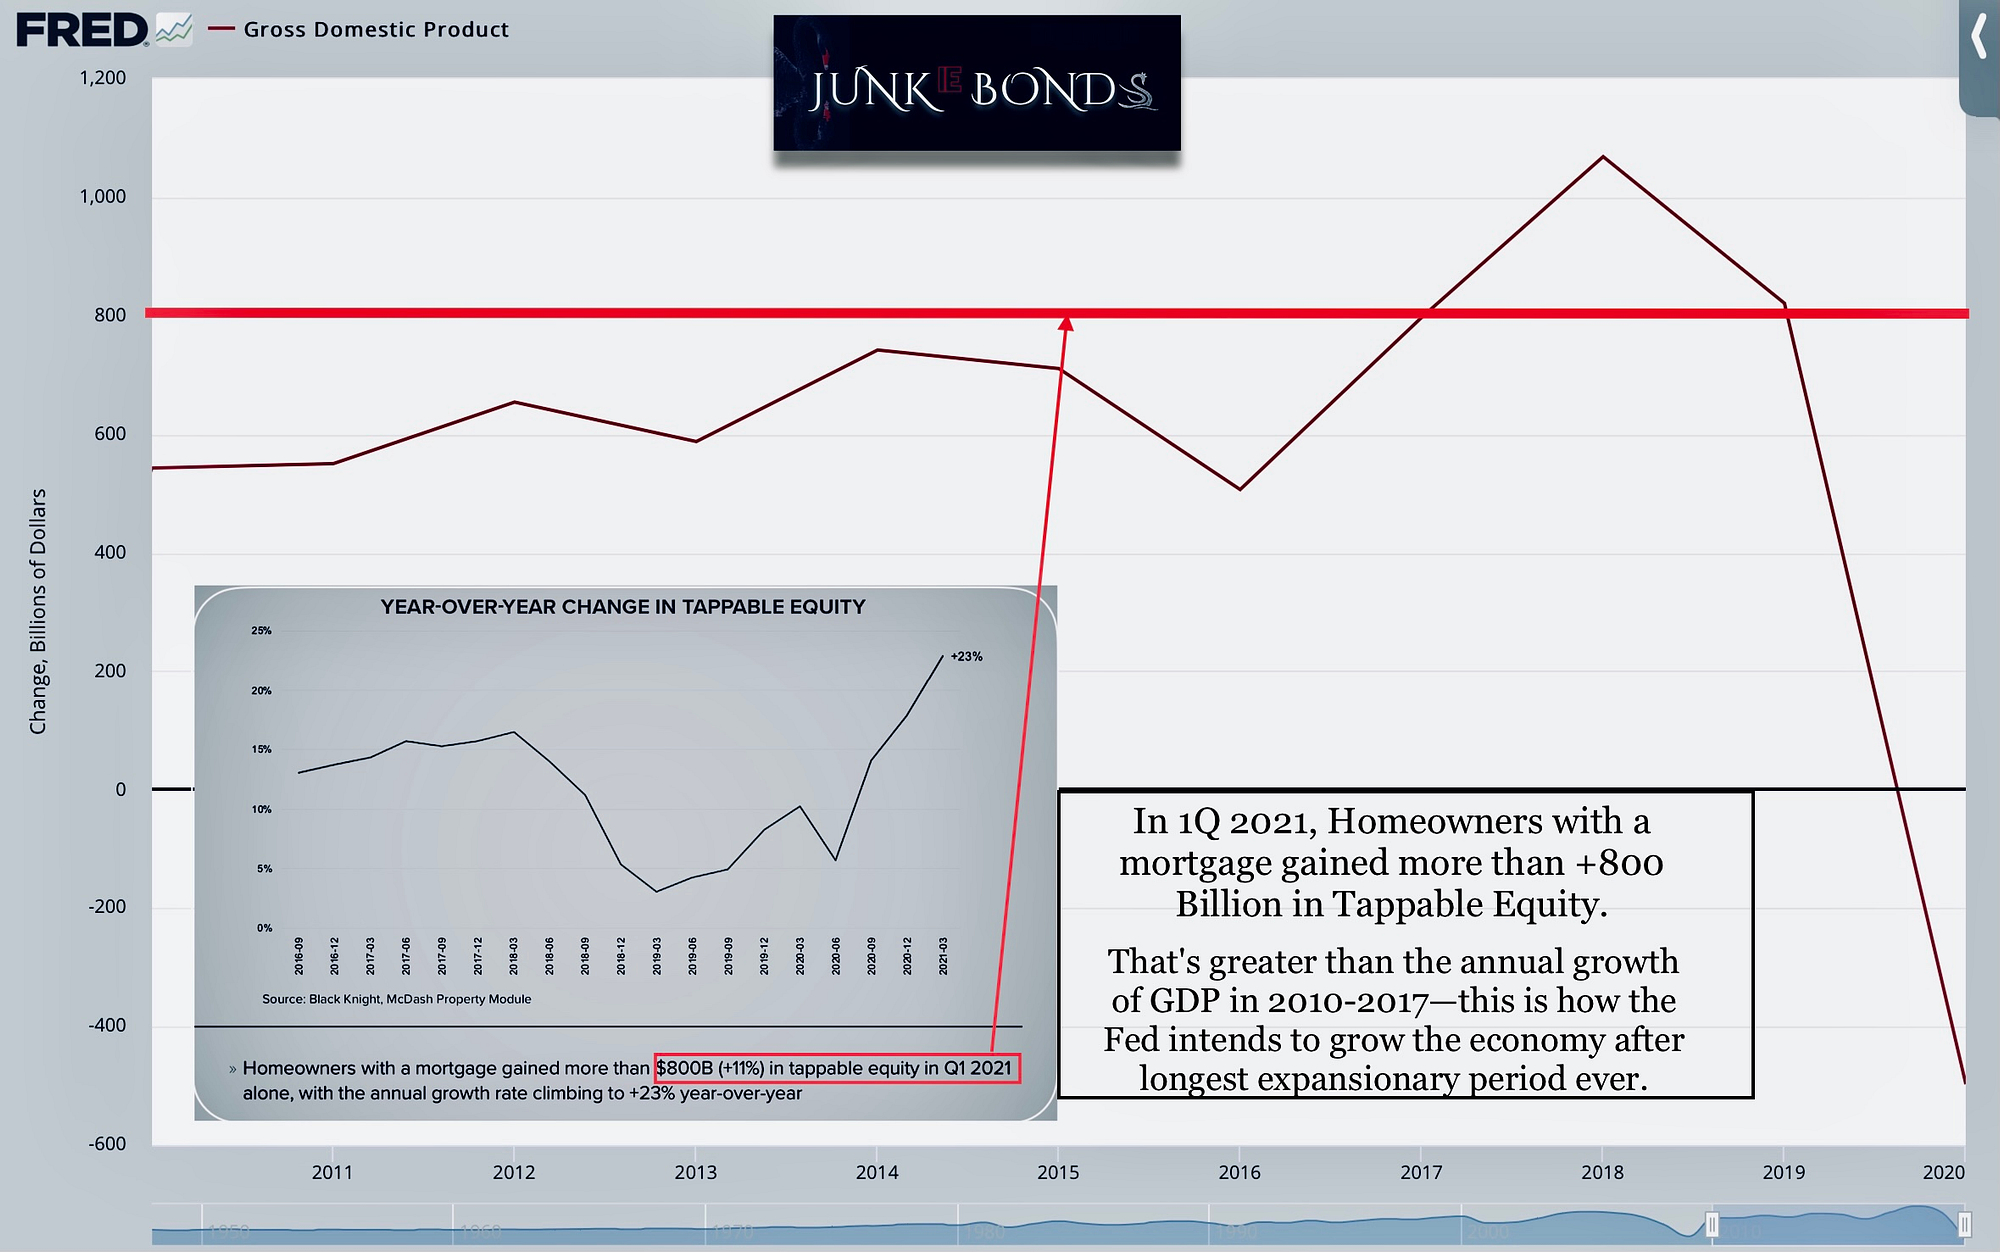
In 1Q of 2021 Tappable Home Equity of Mortgage Borrowers Appreciated 800B — 1Q home equity annualized is greater than the total YoY value added to gdp in each of the following years individually 2010,11,12,13,14,15,16,17 
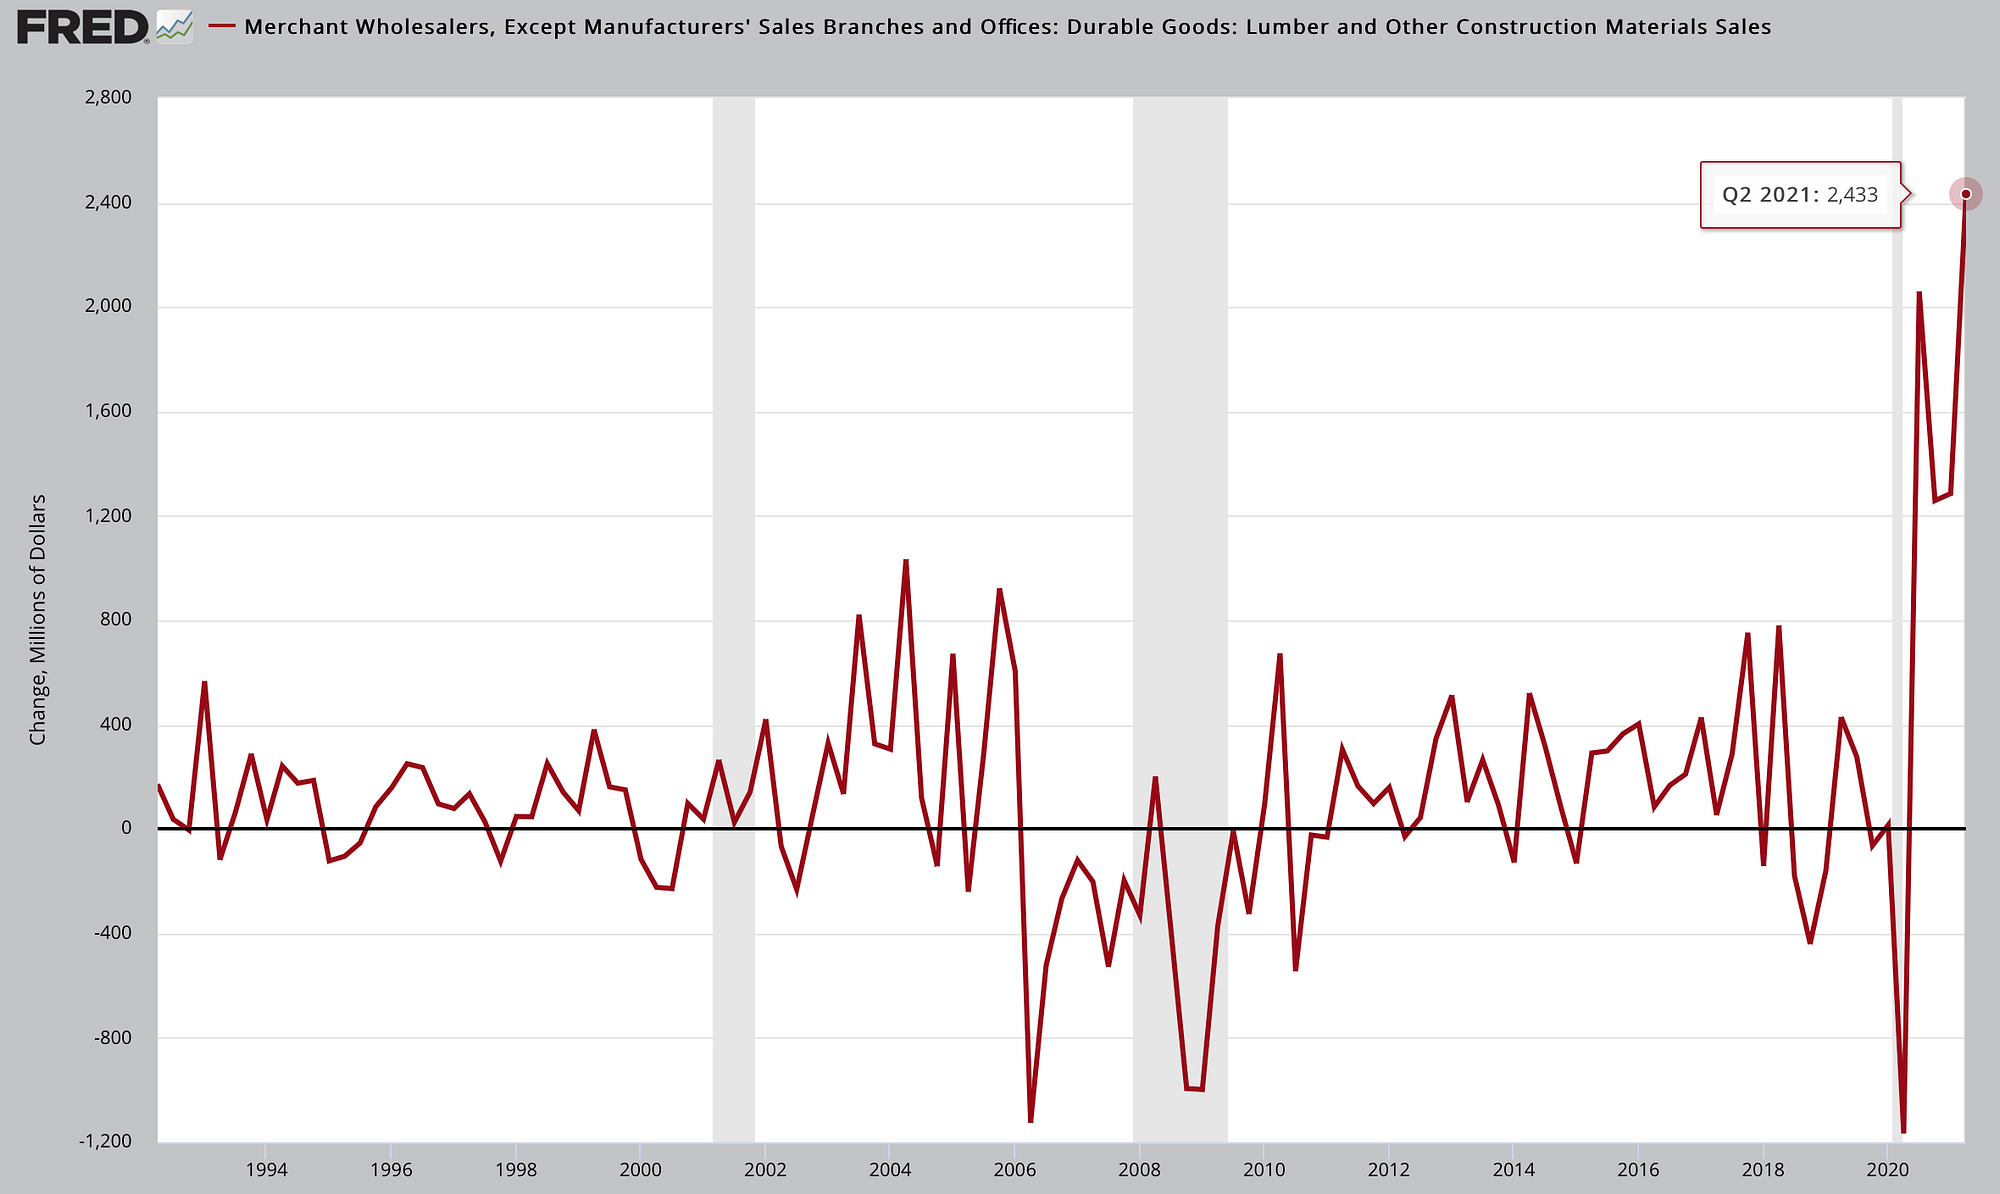
Durable Goods: Lumber and other construction material sales 


Consumer credit: percent change at annual rate — 2Q 2021 Largest quarterly increase after financial crisis 
The Federal Reserve’s Hailmary – Stimulate Economy Through Home Price Appreciation 
+700k Mortgage Borrowers Reach The End of Their forbearance period(cannot extend) in September and October • This is the largest amount of Monthly Exits for plans fully exhausted, 
REVERSE REPO ECLIPSED 1 TRILLION LAST WEEK!
Read “Consequences of Continued Repo”
Transfer Receipts
Dime Chart
