10 Charts of the Week

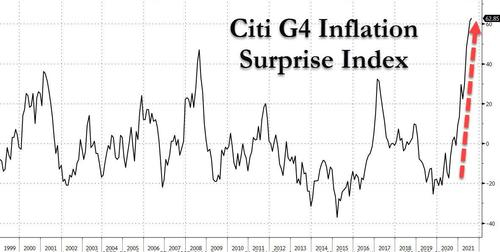
Citi Inflation Index 
Government Total Expenditures 
Government Current Transfer Receipts = Free Money 
S&P National Home Price Index 
Share of Total Net Worth by Income Percentile 
Real Personal Income excluding transfer receipts 
PCE 
Atlanta Fed Home Affordability 
Correlation between S&P Futures and 10yr Treasury Futures 
Construction Spending: Residential
