Goldman Trader: You Make Your Big Money When Central Banks Make A Policy Error… Like Now
By Tony Pasquariello, head of hedge fund sales at Goldman Sachs
Another extraordinary week of eye-popping price action in equities, rates and commodities. With regard to the unrelenting pressure on stocks, there are two clear-and-present dangers:
- inflation remains high, so the Fed still has a lot of ground to cover;
- the risk of a hard landing is increasing.
Let me start with a quick step back:
As last year rolled along, you could have been excused for developing an instinct — a cautious instinct — that the big dynamics in the game were changing for the worse.
By way of reminder — and, to illustrate just how much the financial ecosystem has changed — 2021 will be remembered as the year that marked "record everything": record M&A, record new issue, record retail activity … and record highs in the stock, housing and crypto markets.
The underlying drivers were no mystery: COVID provoked a dual policy response the likes of which the world had never seen.
Said another way: the monetary surge alongside a fiscal barrage was overwhelming force, and it resulted in a spectacularly profitable environment for almost every risky asset you can think of.
In the plainest description, that era produced risk-adjusted returns on a simple 60/40 stock/bond asset mix that were 3x the long-term average.
Flash forward to the present day: those policy tides have receded, and recent weeks have witnessed the most severe tightening of US financial conditions since the GFC (consider that designation for a moment).
The underlying drivers are, once again, not a mystery: inflation is not clearly under control, so the Fed is doing things today would have been unimaginable not so long ago.
On that last point, consider this: headed into last June’s FOMC meeting, the bond market was telling you the Fed wouldn’t begin liftoff until May of 2023, and the implied terminal funds rate was just 1.95%; exactly one year later, we’re moving in 75 bps clips and the market is telling you the target rate will be at 3.77% come May of 2023.
Again, in the plainest description, that same 60/40 package is now seeing its worst performance in … 60 years.
In thinking through the path from here, history suggests the stock market bottoms when growth momentum improves — or when the Fed blinks.
Well, we’re still in the midst of a sloppy run of US economic data (perhaps distorted by the goods-to-services rotation) … and, the building blocks of inflation (commodities, shelter, wages and healthcare) are not backing down … so, it’s reasonably hard for the market to see how either of those two conditions will be satisfied in the very near-term.
Said another way, the hard truth is the Fed is tightening into a slowdown [ZH: something we said back in December….]
What time is Jean-Claude Trichet speaking to explain why the Fed is hiking rates into a recession
— zerohedge (@zerohedge) December 2, 2021
… they NEED tighter financial conditions to take the fight to inflation, as the scoreboard currently reads 8.6% headline CPI vs 1.50% Fed Funds … so, the cat-and-mouse game continues for a while longer … during which time the odds of a hard landing are presumably rising.
One last point of worry, then I’ll try to find some middle ground: as a colleague pointed out, for much of the past 15 years, global central banks hugely influenced the one asset that most every other asset was priced off; now, we’re on the other side of that coin and that overwhelming force is against you.
Now, if I were to articulate a more bullish case, the good news is expectations around the path of forward rates have been hugely reset by now; in the doing, we saw a serious de-rating of the equity multiple, enormous risk transfer and the market down 10 of the past 11 weeks (that’s never happened before).
In addition, Friday was quarterly derivatives expiry … during my time in the markets, every once in a while quarterly expiry marked a significant short-term inflection point … witness December of 2018 and March of 2020.
So, while trying to keep my eye on the big ball, which is still not particularly friendly for risk, I’m tactically open-minded to the idea that S&P has taken enough heat, for the moment anyway.
I’m taker of views, ideas, feedback.
* * *
A few other quick points, and a few charts that are not so subtle:
1. The reason that I earlier referenced the wedge between spot Fed Funds of 1.50% and headline CPI of 8.6% is the following comment from Powell this week: “headline inflation is important for expectations. the public’s expectations, why would they be distinguishing between core inflation and headline inflation? Core inflation is something we think about because it is a better predictor of future inflation, but headline inflation is what people experience. They don’t know what core is. Why would they? They have no reason to. So expectations are very much at risk due to high headline inflation” (link).
2. This week marked the one year-anniversary of Jay Powell’s initial pivot to the hawkish side. You don’t need me to tell you this, but I can’t resist: US 2-year note yields were marked at 15 bps — yes, fifteen basis points — into that meeting.
3. As a wise macro trader once said, you make your big money when the central banks make a policy error. At this point in the program, I pause to remind you that the Fed just stopped buying bonds… three months ago.
4. Who has thicker skin, the BOJ (the last anchor of global duration, who held the YCC line again this week, link) or the US household investor (who put another $16bn into equity funds last week, link)?
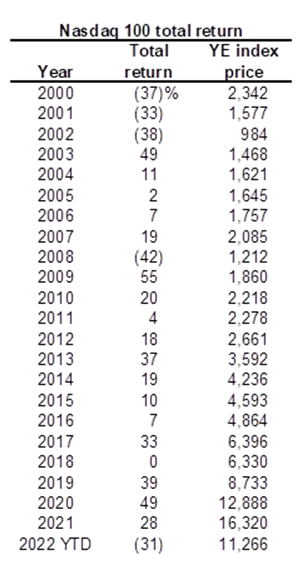
5. A simple table of the total returns on NDX (thanks for Jenny Ma in GIR, and Charlie Bilello for the basic idea). This will provoke a lot of different reactions. At the very least, I’d argue it illustrates how truly high velocity an asset it is, and has always been:
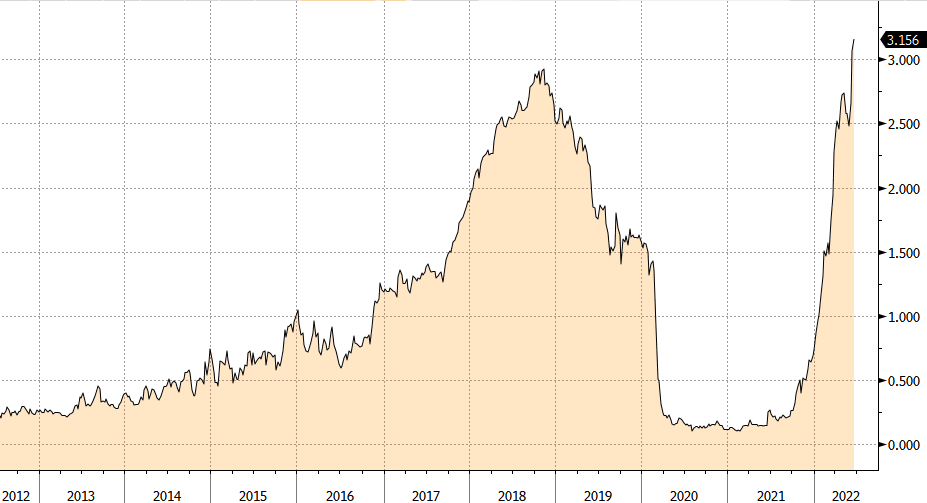
6. There are many ways to illustrate the recent damage in the rates space. In the spirit of simplicity, I’m again going with this plain old chart of the US 2-year yield. For the avoidance of doubt, the past week saw the largest 2-day backup in 40 years. As they say in the trade, what the bond market wants, the bond market gets:
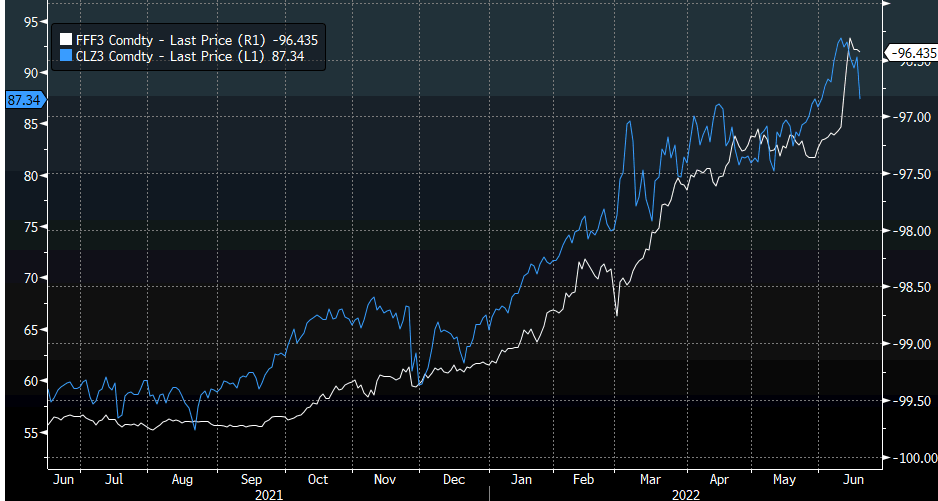
7. If you’ve been long of deferred oil and short of Fed Funds futures (inverted here for fit), you’ve had a very steady hand for the past year (and, if you bought CLZ3 on the day when front-month crude oil traded negative in April of 2020, this Bud’s for you). My instinct is this game is not over yet, while respectful of last week’s retracement in oil:
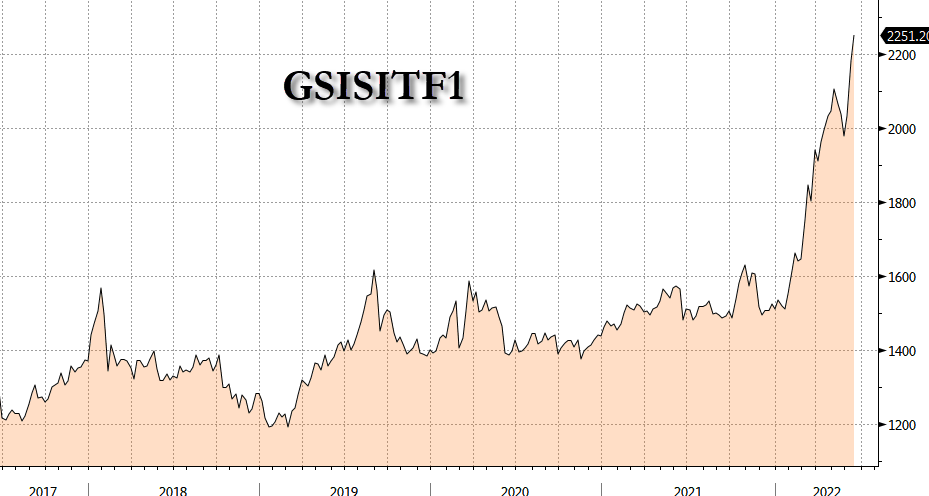
8. Sticking with the recent thread, the hunting remains exceptionally good for trend-following macro strategies:
Tyler Durden
Sun, 06/19/2022 – 20:00