“There are two types of investors”, according to Bank of America CIO Michael Hartnett: those who want to get rich, and those that want to stay rich.
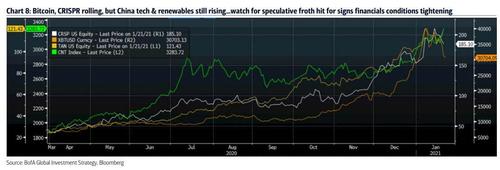
That’s how Hartnett begins his latest Flow Show note, warning that “when those who want to stay rich start acting like those who want to get rich, it suggests a late-stage speculative blow-off” which one looks at Gamestop today confirms is precisely where in the bubble we are today. Yet even though some speculative “froth” assets have gotten hit, with Bitcoin and CRISPR rolling on one hand, on the other China tech & renewables still rising (and actually so is bitcoin… again).
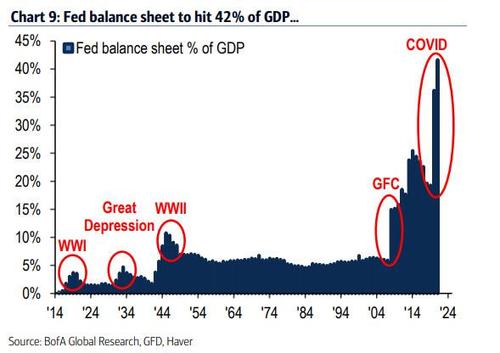
Why is all this happening? The same reason we said back in 2009 when we were blasted tinfoil conspiracy theorists: the “Immoral hazard” unleashed by those in charge… a stimulus which BofA sees expanding the Fed balance sheet to a grotesque 42% of US GDP…
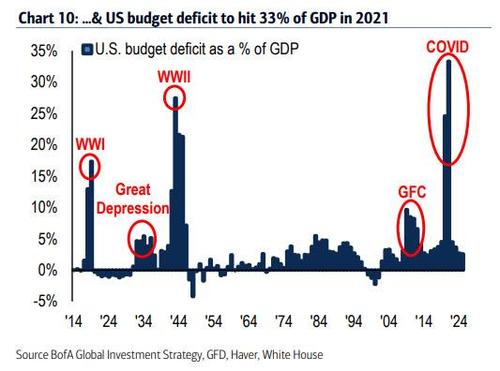
… and sending the US budget deficit to a record 33% of GDP
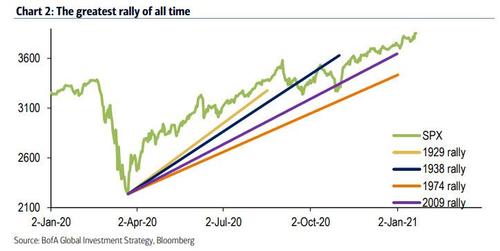
It is this extreme policy, Hartnett writes, which “remains the best explanation for extreme rally off lows in 2020, and the consensus macro boom in 2021.”
And with DC policies fueling the Wall Street price bubble, Hartnett believes that Wall Street asset inflation will eventually drag Main Street inflation higher, risking a disorderly rise in bond yields, which results in a taper tantrum, tighter financial conditions and “volatility events” because there is nothing ever new under the sun and “twas ever thus”:
- 1994: Orange County, Mexico
- 1999/2000: internet
- 2007/2008: subprime, housing
- 2013: IG, EM
- 2018: HY, leveraged loans.
So if a sharp, disorderly spike in yields is the trigger for the crash, what will catalyze it? The same thing that Hartnett has been warning about for the past 3 months: the widespread use of the covid vaccine (hence his repeat warning to “Sell the Vaccine”).
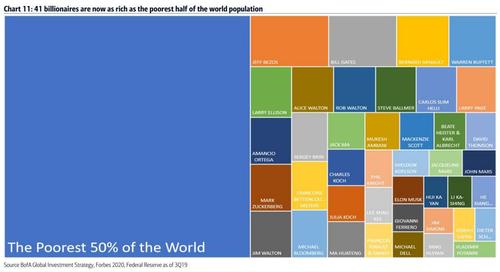
Meanwhile, until that happens, US policy continues stoking inequality, with 41 billionaires now as rich as the poorest half of the world’s population …
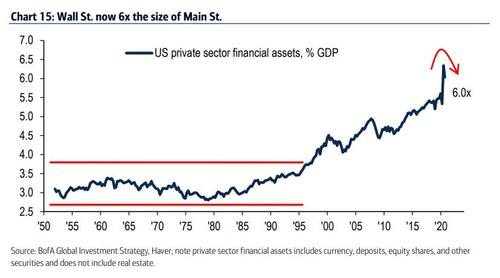
… the market cap of Tesla now exceeding MSCI India, Wall Street assets 6.0x Main Street GDP…
… S&P500 trailing PE 2nd highest in 100 years, which in turn threatens populist backlash via taxation and regulation. And we have just the right president to implement it.
To be sure, inflation alone will do nothing to spark a crash – any serious selloff would require Fed intervention, namely tapering (first) and tightening or rate hikes (next). To Hartnett the critical early signs that financial conditions are tightening will be i) a US dollar rally and ii) weaker corporate bonds (LQD
Of course, BofA is not predicting the endgame here, and believes that after a Q1 correction crushes the froth in the market, things will largely go back to normal, and according to Hartnett, his base case for 2021, one of “big rotation and small returns”…
… assumes on the big investment trends of i) bigger government, ii) smaller world, iii) US dollar debasement, iv) FX wars, v) monetary to fiscal excess, vi) subservient central banks, vii) peak inequality; viii) buy-the-dip strategies, which however should be
confined to inflation assets (i.e. small cap, value, EAFE, EM, commodities, gold) that will increasingly indicate 2020 was secular low point for rates & inflation; As a side note, Hartnett points to the multi-year outperformance of US small cap stocks following secular lows in 1933, 1942, 1963, and 1975.
* * *
We leave you with some brief bulletin observations from Hartnett:
Winners & losers: winners: CRISPR 21%, solar 18%, EV 12%, energy 11%, China tech 11%, oil 10%, EEM 9%; losers: staples -2%, silver-3%, 30-year Treasury -5%.
For Whom the Barbell Tolls: investor embrace “Asia growth, global value” barbell; most overbought sectors (trading >20% above 200dma) are China/Japan/Korea/Taiwan tech and UK/Aussie/Brazil materials & HK/India/Spain banks.
Weekly flows: $21.6bn to equities, $17.4bn to bonds, $1.6bn to gold, $13.5bn from cash; past 12 weeks largest inflow ($255bn) to stocks ever (follows GOAT rally).
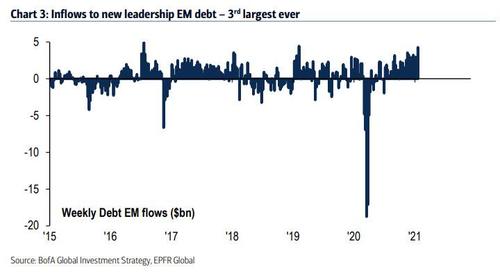
For Whom the Barbell Flows: inflows to new leadership EM debt ($4.3bn, 3rd largest ever – Chart 3), EM stocks ($4.1bn), financials ($2.3bn), energy ($1.6bn), bank loans ($1.0bn); still inflows to IG bonds ($8.5bn), health care ($2.4bn, 7th largest), tech ($2.0bn).
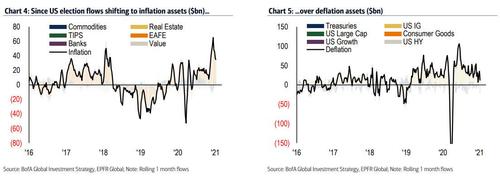
Investors buying Inflation: since US election, trend in flows shifting to inflation assets (commodities, real estate, TIPS, EAFE, banks, value – Chart 4) over deflation assets (UST, IG, HY, large cap, consumer, growth – Chart 5), $457bn vs $320bn past 10 weeks, c/o with $0.8tn vs $3.2tn in prior 4 years; inflation expectations unambiguously rising as YoY lumber 36%, shipping rates 19%, appliances 17%, raw materials 13%, home prices 8%.
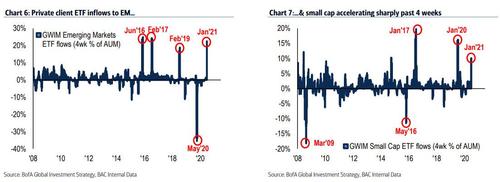
BofA private clients: GWIM AA 62.1% equity, 19.5% debt, 12.1% cash; note private client ETF inflows to EM & small cap accelerating sharply past 4 weeks (Charts 6 & 7).
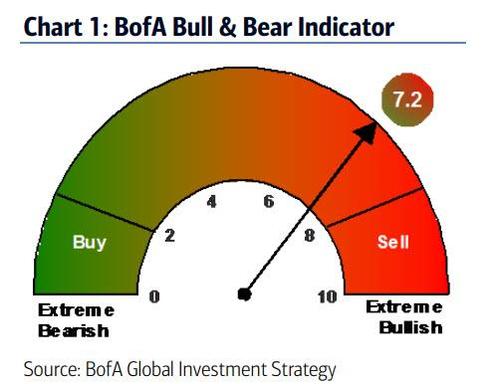
Waiting for Godot: BofA Bull & Bear Indicator up to 7.2 (Chart 1) from 7.1; note Bull & Bear indicator peaked 7.1 exactly 12 months ago when “sell signal” (>8) denied due to US Treasury rally in Jan’20; yields trending higher in ‘21, we expect peak positioning & correction in Q1.
Tyler Durden
Fri, 01/22/2021 – 14:25
