/February Macro: 2020 increase in the goods deficit was $51.5 billion, or 6.0 percent, to $915.8 billion.
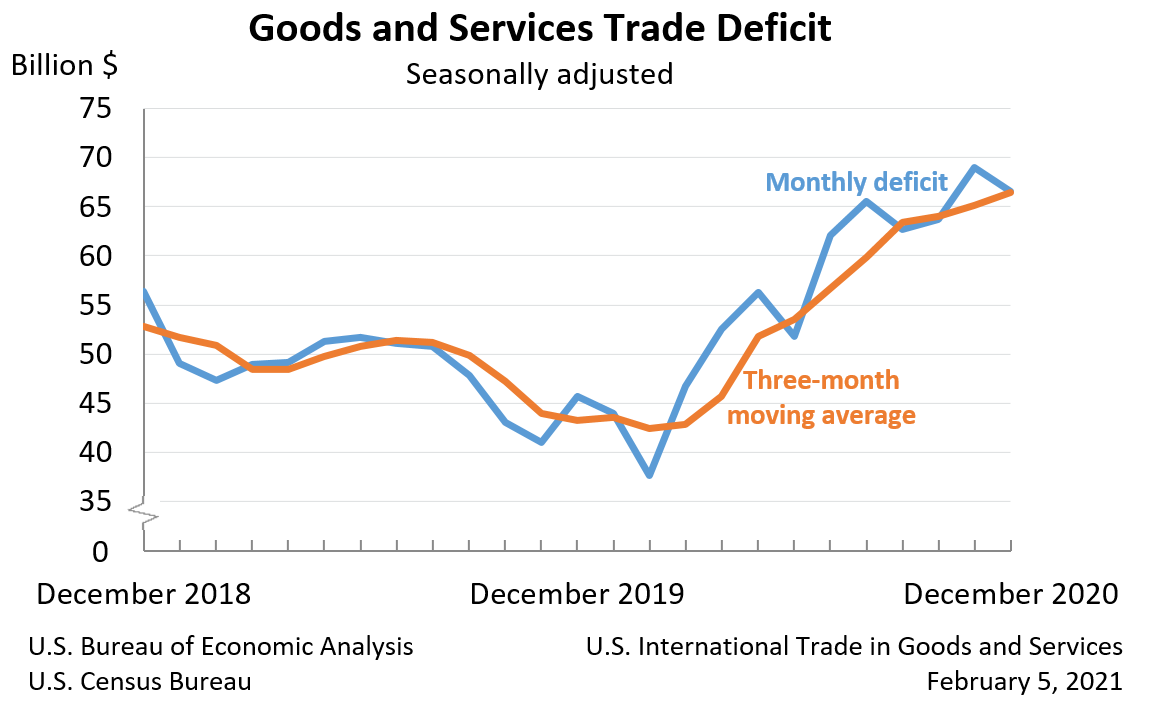
The U.S. Census Bureau and the U.S. Bureau of Economic Analysis announced today that the goods and services deficit was $66.6 billion in December, down $2.4 billion from $69.0 billion in November, revised.
| Deficit: | $66.6 Billion | -3.5%° |
| Exports: | $190.0 Billion | +3.4%° |
| Imports: | $256.6 Billion | +1.5%° |
| Next release: March 5, 2021(°) Statistical significance is not applicable or not measurable. Data adjusted for seasonality but not price changesSource: U.S. Census Bureau, U.S. Bureau of Economic Analysis; U.S. International Trade in Goods and Services, February 5, 2021 |
Coronavirus (COVID-19) Impact on International Trade in Goods and Services
Exports and imports in December 2020 reflect both the ongoing impact of the COVID-19 pandemic and the continued economic recovery from the sharp declines earlier in the year. The full economic effects of the pandemic cannot be quantified in the trade statistics because the impacts are generally embedded in source data and cannot be separately identified. The Census Bureau and the Bureau of Economic Analysis continue to monitor data quality and have determined estimates in this release meet publication standards. For more information, see the frequently asked questions on goods from the Census Bureau and on services from BEA.
Exports, Imports, and Balance (exhibit 1)
December exports were $190.0 billion, $6.2 billion more than November exports. December imports were $256.6 billion, $3.8 billion more than November imports.
The December decrease in the goods and services deficit reflected a decrease in the goods deficit of $2.8 billion to $84.2 billion and a decrease in the services surplus of $0.4 billion to $17.5 billion.
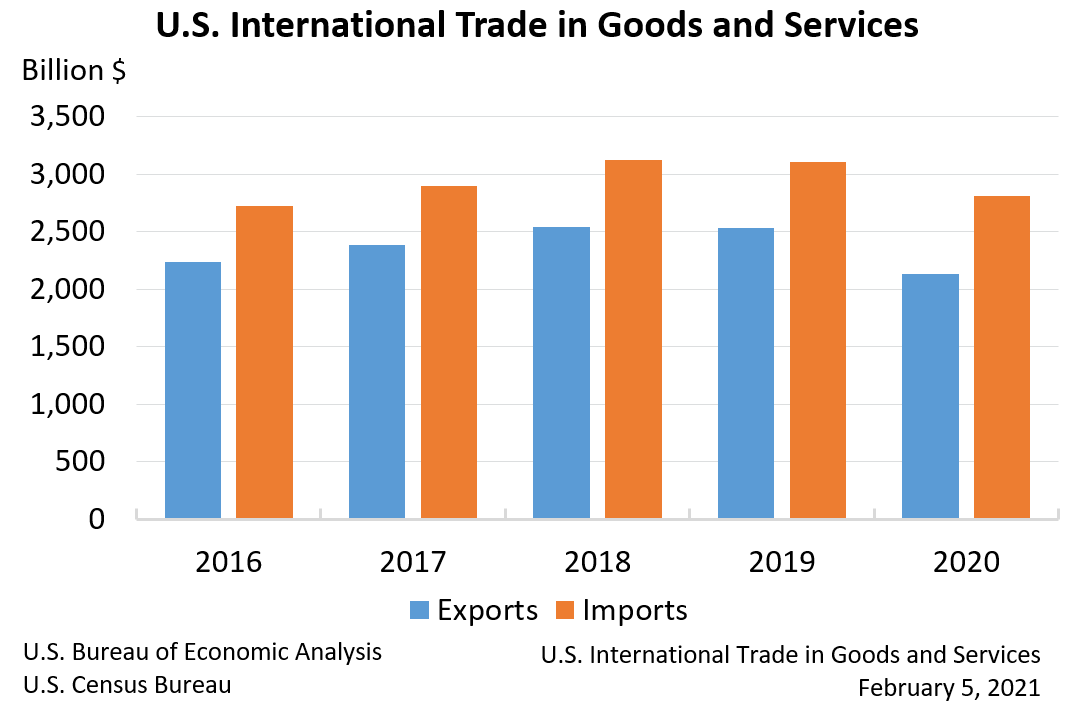
For 2020, the goods and services deficit increased $101.9 billion, or 17.7 percent, from 2019. Exports decreased $396.4 billion or 15.7 percent. Imports decreased $294.5 billion or 9.5 percent.
Three-Month Moving Averages (exhibit 2)
The average goods and services deficit increased $1.3 billion to $66.5 billion for the three months ending in December.
Year-over-year, the average goods and services deficit increased $23.2 billion from the three months ending in December 2019.
Exports (exhibits 3, 6, and 7)
Exports of goods increased $6.0 billion to $133.5 billion in December.
Exports of goods on a Census basis increased $5.9 billion.
Net balance of payments adjustments increased $0.1 billion.
Exports of services increased $0.3 billion to $56.5 billion in December.
Imports (exhibits 4, 6, and 8)
Imports of goods increased $3.1 billion to $217.7 billion in December.
Imports of goods on a Census basis increased $3.0 billion.
Net balance of payments adjustments increased $0.2 billion.
Imports of services increased $0.7 billion to $38.9 billion in December.
Real Goods in 2012 Dollars – Census Basis (exhibit 11)
The real goods deficit decreased $2.4 billion to $94.8 billion in December.
Revisions
In addition to revisions to source data for the November statistics, the seasonally adjusted goods data were revised for January through November so that the totals of the seasonally adjusted months equal the annual totals.
Revisions to November exports
Revisions to November imports
Goods by Selected Countries and Areas: Monthly – Census Basis (exhibit 19)
The December figures show surpluses, in billions of dollars, with South and Central America ($3.9), Hong Kong ($2.1), OPEC ($1.9), Brazil ($0.8), Saudi Arabia ($0.6), and United Kingdom ($0.2). Deficits were recorded, in billions of dollars, with China ($28.1), European Union ($19.2), Mexico ($10.3), Germany ($5.8), Japan ($5.5), Taiwan ($3.2), Italy ($3.2), India ($2.8), South Korea ($2.7), France ($1.6), Canada ($1.1), and Singapore ($0.9).
Annual Summary for 2020
Exports, Imports, and Balance (exhibit 1)
For 2020, the goods and services deficit was $678.7 billion, up $101.9 billion from $576.9 billion in 2019. Exports were $2,131.9 billion, down $396.4 billion from 2019. Imports were $2,810.6 billion, down $294.5 billion from 2019.
The 2020 increase in the goods and services deficit reflected an increase in the goods deficit of $51.5 billion, or 6.0 percent, to $915.8 billion and a decrease in the services surplus of $50.4 billion, or 17.5 percent, to $237.1 billion.
As a percentage of U.S. gross domestic product, the goods and services deficit was 3.2 percent in 2020, up from 2.7 percent in 2019.
Exports (exhibits 3, 6, and 7)
Exports of goods decreased $217.7 billion to $1,434.8 billion in 2020.
Exports of goods on a Census basis decreased $211.5 billion.
Net balance of payments adjustments decreased $6.1 billion.
Exports of services decreased $178.7 billion to $697.1 billion in 2020.
Imports (exhibits 4, 6, and 8)
Imports of goods decreased $166.2 billion to $2,350.6 billion in 2020.
Imports of goods on a Census basis decreased $161.0 billion.
Net balance of payments adjustments decreased $5.3 billion.
Imports of services decreased $128.3 billion to $460.1 billion in 2020.
Goods by Selected Countries and Areas – Census Basis (exhibits 14 and 14a)
The 2020 figures show surpluses, in billions of dollars, with South and Central America ($39.8), Netherlands ($18.1), Hong Kong ($16.1), OPEC ($15.7), Brazil ($11.7), Australia ($9.1), United Kingdom ($8.8), and Belgium ($6.7). Deficits were recorded, in billions of dollars, with China ($310.8), European Union ($183.4), Mexico ($112.7), Germany ($57.3), Switzerland ($56.7), Ireland ($55.9), Japan ($55.4), Malaysia ($31.7), Taiwan ($29.9), Italy ($29.5), Thailand ($26.4), South Korea ($24.8), India ($23.8), France ($15.6), Canada ($15.0), Indonesia ($12.8), and Russia ($12.0).
* * *
All statistics referenced are seasonally adjusted; statistics are on a balance of payments basis unless otherwise specified. Additional statistics, including not seasonally adjusted statistics and details for goods on a Census basis, are available in exhibits 1-20b of this release. For information on data sources, definitions, and revision procedures, see the explanatory notes in this release. The full release can be found at www.census.gov/foreign-trade/Press-Release/current_press_release/index.html or www.bea.gov/data/intl-trade-investment/international-trade-goods-and-services. The full schedule is available in the Census Bureau’s Economic Briefing Room at www.census.gov/economic-indicators/ or on BEA’s website at www.bea.gov/news/schedule.
* * *
Next release: March 5, 2021, at 8:30 A.M. EST
Fed Emergency Bank Bailout Facility Usage Hits New Record High; Money Market Funds See Small…
US Homeowner Equity Drops For First Time Since 2012 The housing bull market has peaked…
JPMorgan and Citigroup Are Using the Same Accounting Maneuver as Silicon Valley Bank on Hundreds…
At Year End, 4,127 U.S. Banks Held $7.7 Trillion in Uninsured Deposits; JPMorgan Chase, BofA,…
Do you really own something if someone forces you to make never-ending (and ever-increasing) payments…
Doug Casey On Why The US Is Headed Into Its 'Fourth Turning' Authored by Doug…