March Payrolls Preview: Big Data Hints At Blowout Numbers
The March nonfarm Payroll Report will be released at 8:30 am tomorrow, on Good Friday, when most markets will be shut, and those that are open – like US cash Treasurys, which close at noon – will suffer from thin liquidity conditions, and therefore, potentially choppy price action. As noted earlier, amid expectations of a potentially blockbuster payrolls report where consensus is 660K but whisper numbers are at or above 1 million…
… due to much stronger "big and/or alternative data" reads (see below), JPM warned that markets should expect extra treasury volatility should the jobs number emerge as a big upside (or downside) surprise due to the lack of liquidity in the bond market. As the bank warned, "our work in the past has shown that Treasury yields are sensitive to payroll surprises and that these moves can be amplified when employment data are released on holiday-shortened trading sessions."
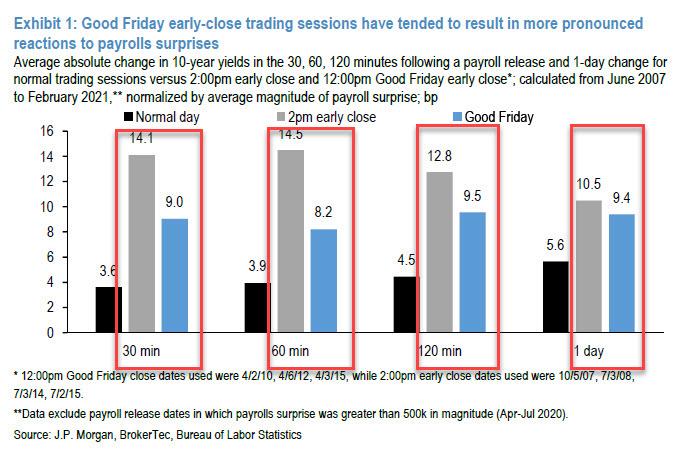
The chart above shows the average absolute change in 10-year yields over various periods around payrolls releases, normalized by the average size of payrolls surprise, during various types of trading sessions. The data show that in the hours following payrolls releases on Good Friday 12pm early-close sessions, Treasury markets appear to be approximately 2 times more volatile than observed during a normal session, for a given magnitude of surprise, and in 2pm early close sessions, they are roughly 3 times more volatile than that of a full session following releases. Looking ahead, JPM concludes that "these results suggest that Treasury yields could exhibit greater volatility in response to a surprise in the employment report on Friday."
Blockbuster surprise – and fireworks in the bond market – aside, current expectations are as follows:
- Change in non-farm payrolls +660k in March from the 379k printed in Feb;
- Change in private non-farm payrolls +643K, up from 465K
- Unemployment rate 6.1% from 6.2%.
- Average hourly earnings M/M +0.1%, from 0.2%
- Average hourly earnings Y/Y +4.5%, from 5.3%
- Labor force participation rate 61.5%, from 61.4%
As Newsquawk adds, the signals from the weekly initial jobless claims data are subject to distortions, making it difficult to infer an accurate read: initial jobless claims in the week that corresponds to the jobs report survey window jumped in the week, although this was a result of the sharp rise in Texas, which accounted for around half of the rise, due to weather conditions seen in February; but PUA benefit claims fell, which could have been a result of claims in Ohio, which were reported to be subject to fraud, came down. Continuing claims in the corresponding week, however, fell by more than analysts were anticipating, which bodes well for the BLS data.
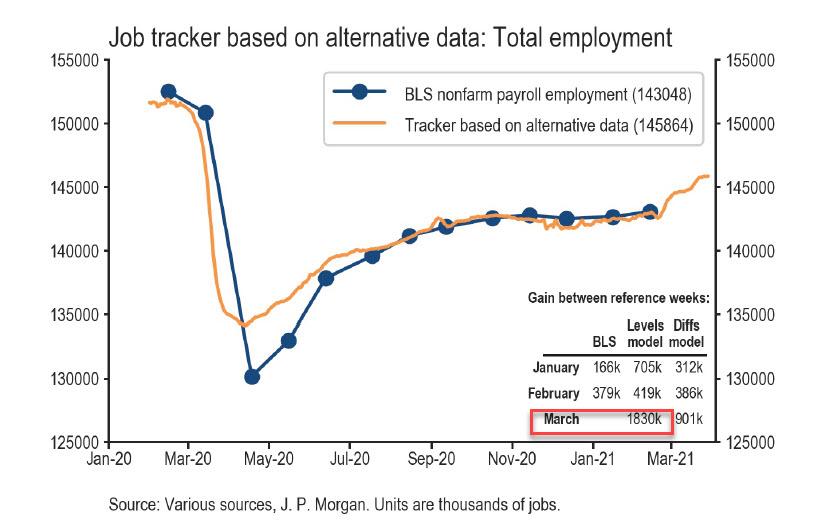
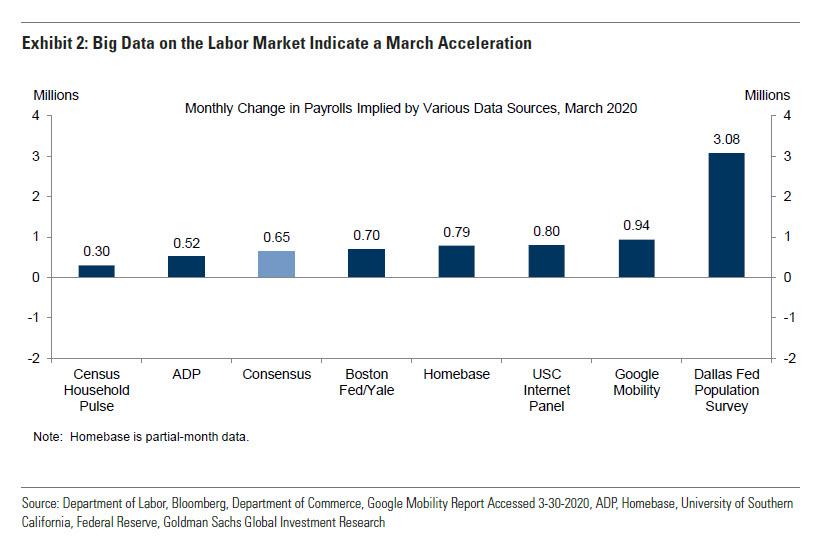
In its preview of tomorrow’s jobs report, Goldman is far more upbeat than consensus and estimates that nonfarm payrolls rose 775k in March, roughly double the 379k pace in February and above the consensus of 660K, as falling infection rates and a net easing of business restrictions likely supported job growth in virus-sensitive industries, particularly leisure and hospitality. Big Data employment signals also indicate a pickup in job growth, with the more accurate measures clustered in the 700-900k range.
Additionally, Goldman expects a rebound from the winter storms in February, with a net boost to March job growth on the order of 50-100k. Finally, the bank believes higher jobless claims readings this year mostly reflect policy incentives and non-economic factors, as opposed to new layoffs.
The surge in payrolls means that Goldman also estimates a three-tenth decline in the unemployment rate to 5.9% (consensus 6.0%), reflecting a strong expected gain in household employment. That being said, a vaccine- and reopening-related rebound in labor force participation is likely to start this month, and this could limit the magnitude of the decline in the jobless rate.
On the wage side, Goldman estimates a 0.1% increase in average hourly earnings (and 4.5% yoy, in line with consensus), due to negative calendar effects and negative composition effects.
Below are some data points arguing for a better-than-expected report:
- Reopening. While cases remain elevated in much of the country, infection rates generally fell and the severity of business restrictions eased between the February and March survey period. Reflecting this, restaurant seatings on OpenTable rebounded sharply to -37% from -57% (yoy survey week to survey week). And in Texas, dining activity had returned to normal shortly after the end of the survey week.

- Big Data. High-frequency data on the labor market were generally positive in March, with five of the seven measures Goldman tracks indicating a better-than-expected report relative to consensus, and stronger gains in the more reliable datasets
- Better weather. Winter storms in the eastern half of the country weighed on February job growth, with an outright decline in US construction employment (-61k, weakest since the April 2020 lockdowns), and nonfarm payroll declines in the West South Central region (-38k, includes Texas). Normalization in the weather suggests scope for a boost to March job growth of 50-100k (mom sa).
- Employer surveys. Business activity surveys increased on net in March. The employment components of both services (+0.9pt to 58.5) and manufacturing (+0.7 to 58.1, the highest level since August 2018) survey trackers increased.
- Job availability. The Conference Board labor differential—the difference between the percent of respondents saying jobs are plentiful and those saying jobs are hard to get — increased into expansionary territory (to +7.8 in March from -0.8 in February), its highest level since March 2020 (+29.5).
- Job cuts. Announced layoffs reported by Challenger, Gray & Christmas fell by 16% in March after declining by 59% in February (mom, SA by GS). Layoffs were at the lowest level since May 2018 (30k, SA by GS).
Neutral/mixed factors:
- Jobless claims. Initial jobless claims declined during the March payroll month, averaging 749k per week vs. 827k in February, although the decrease likely overstates the underlying labor market improvement, since claims in Ohio and Illinois normalized from inflated levels. Continuing claims fell 549k between the payroll survey weeks, but this decline partly reflects expiring regular-state-programs (as opposed to reemployment). Across all employee programs including emergency benefits, continuing claims increased by 82k (some of which reflect benefit renewals following the Phase 4 package).
- ADP. Private sector employment in the ADP report increased by 517k in March, below consensus expectations but above the pace of the official measure in February. Goldman warns that the ADP panel methodology may undercount workers returning to their previous employers, which would argue for a larger gain in the official payroll measure.
As always, pay close attention to the number of unemployed workers on temporary layoff, which spiked to a record-high 18.1mn last April but had retraced to 2.2mn by February of this year.
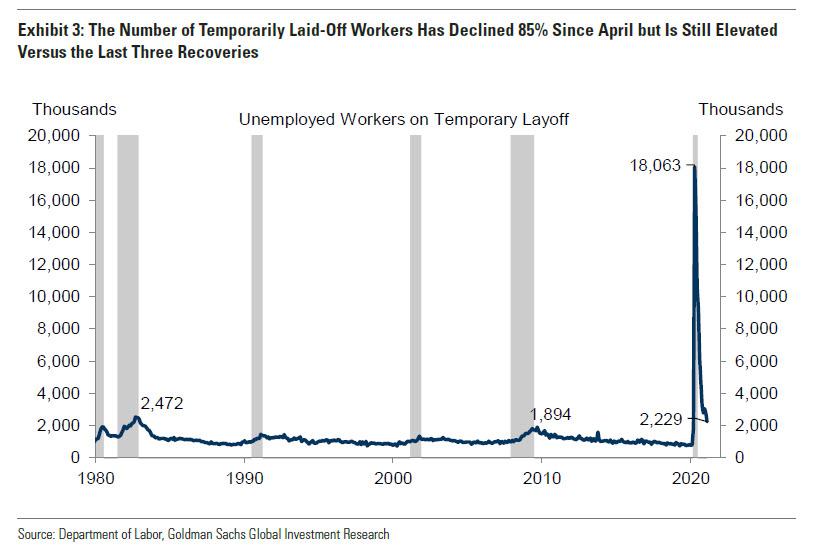
The smaller number of workers left on temporary layoff reduces the scope for the rapid pace of gains seen last summer, but it remains a positive factor relative to the pre-coronavirus pace of job gains.
Tyler Durden
Thu, 04/01/2021 – 22:00