– A collection of charts detailing the real cause of wealth inequality in America since 1971.
Financialization of the
Economy by
Design
1. Economic Changes Of Financialization
2. The rise of the Big Four and fall of community banks
3. Wages, Wealth, and Income
Economic Changes
of Financialization
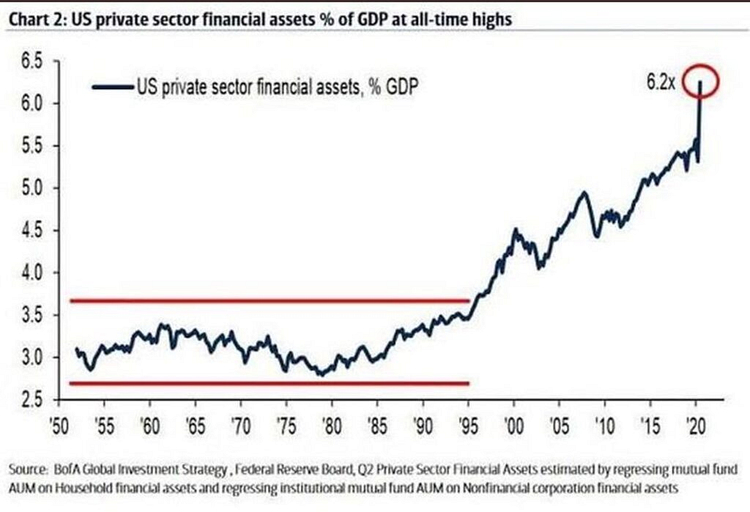
U.s. pRivate sector financIal assets % of gdp
As most charts on this page, a permanent trend begins at the end of the 70’s and continues today. As a percentage of GDP, Financial Assets have more than doubled. This captivates how the economy is designed to benefit a sector that does little for the country and the average American.
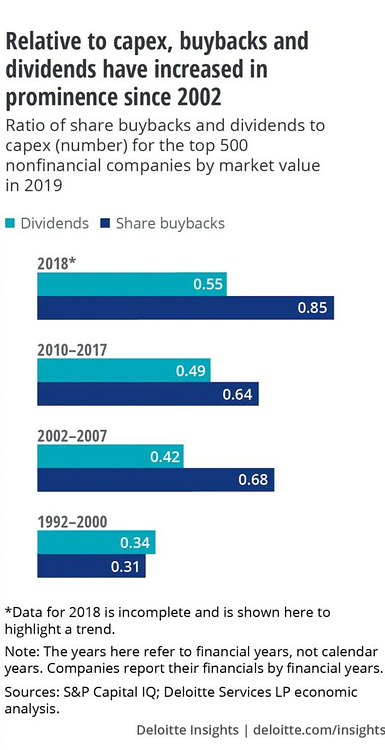
Relative to Capex, Buybacks and Dividends have increased in prominence since 2002.
The ratio of buybacks and dividends to capex spending for the top 500 nonfinancial companies. When the top companies increasingly spend money on dividends and buybacks it reflects a few things.
1. If it occurs repeatedly, they’re not well managed and put the board above the company.
2. Competition is limited.
3. Monetary policy or government regulations have created an economic environment where buybacks are more attractive than Capex—a result of Financialization.
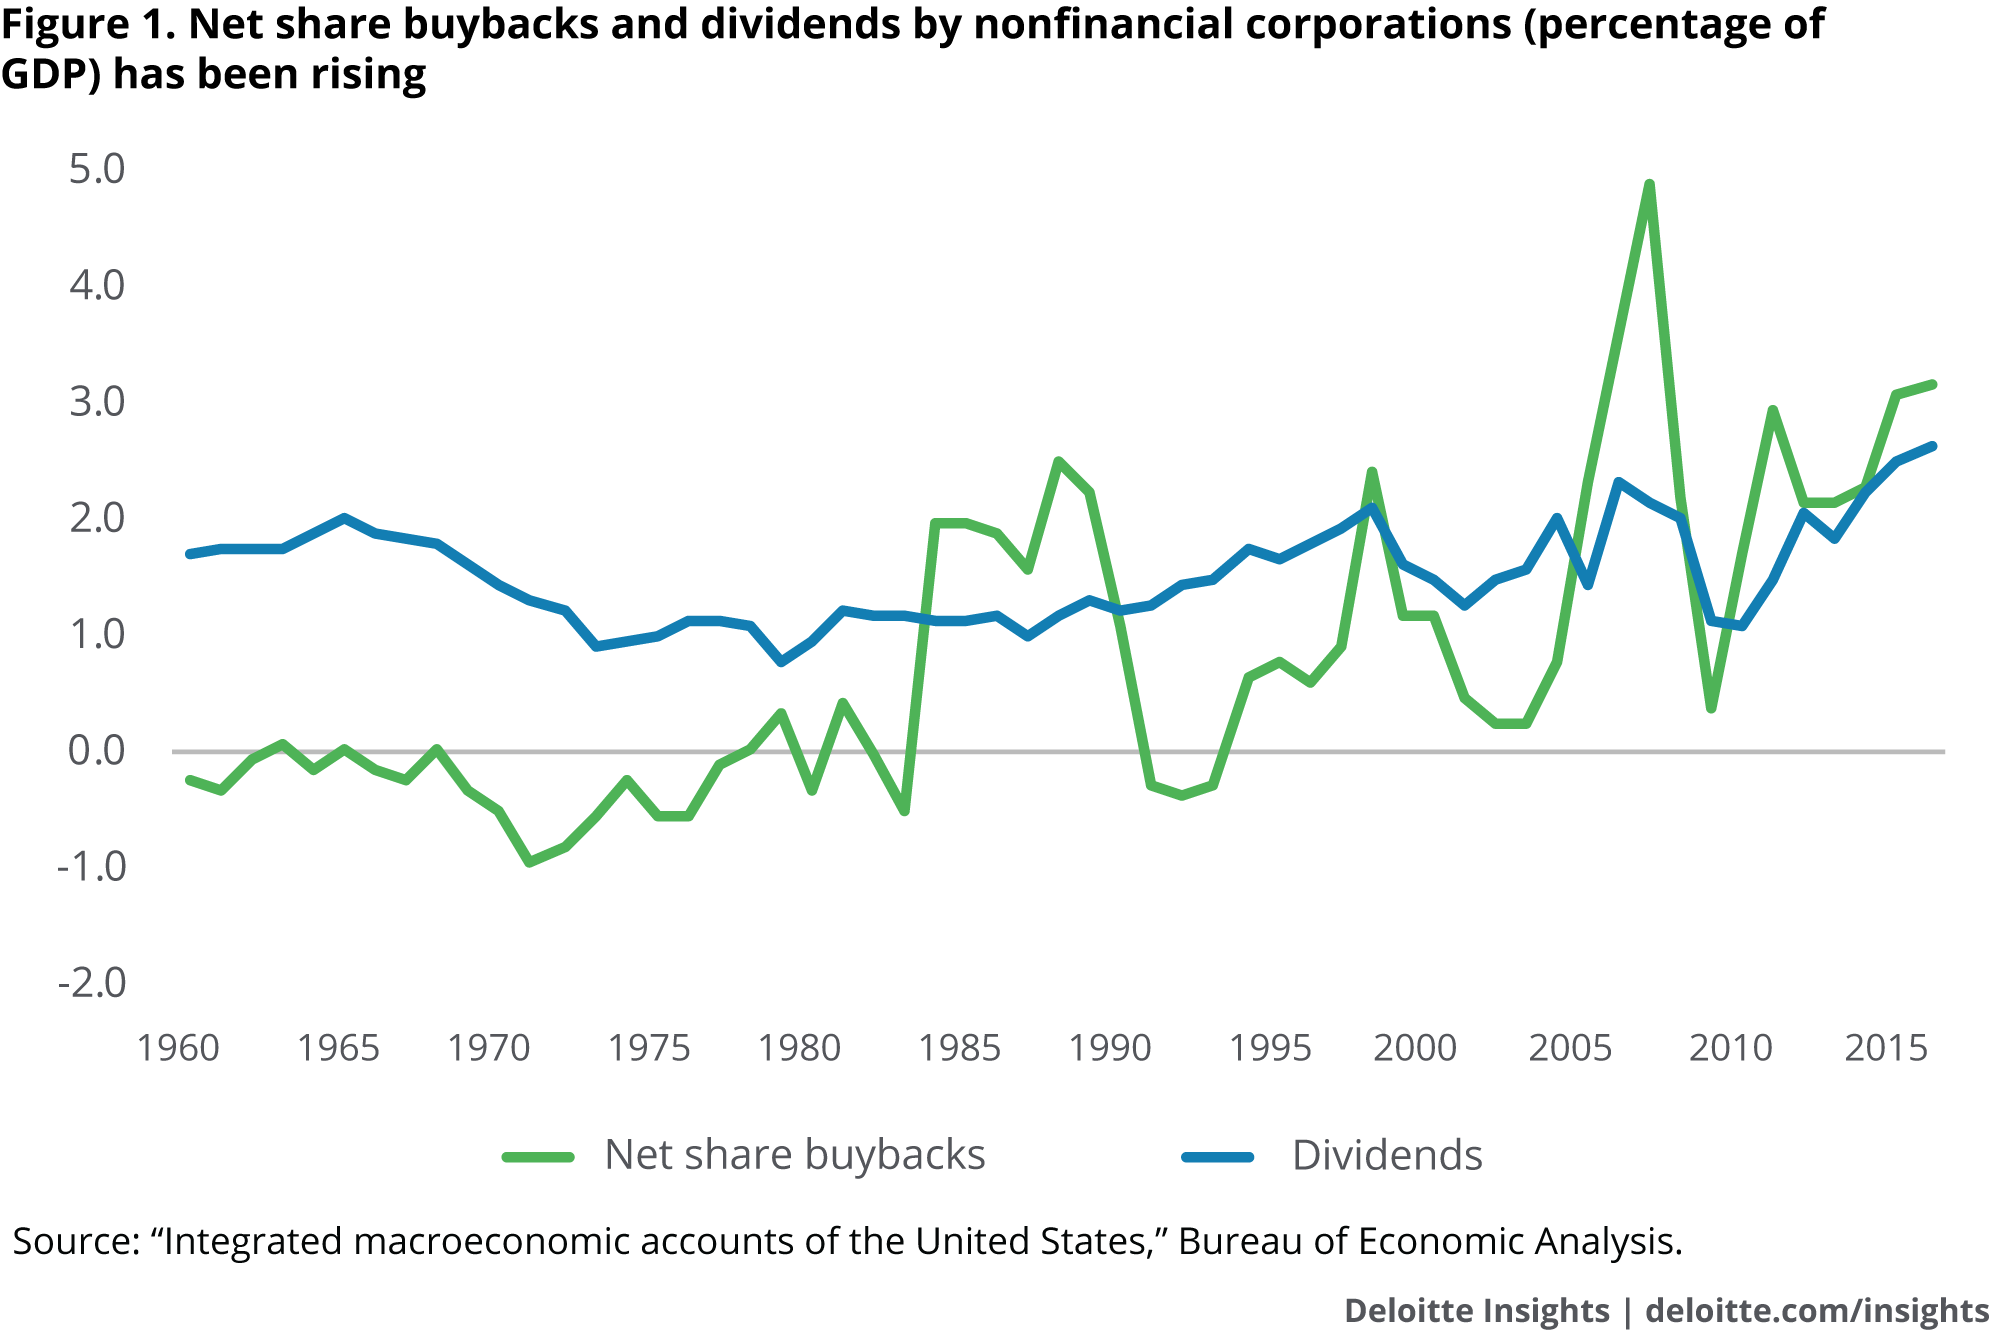
Net Share of buybacks and dividends by nonfinancial corporations – % of GDP
High Income Industries
In 2008-2012, over 1/3 of the top .1% came from the finance and insurance sector compared to 17% in 1981-85. The next 3 industries combined represent a smaller than Finance. The 1% isnt the problem; many in the 1% represent small to medium sized business owners. If we’re to raise taxes on these individuals we are likely to worsen the gap as the top .1% have a team of professionals to avoid taxes.

Another chart comparing incomes from different industries. This data reflects a slightly different picture but finance remains on top. The difference from 1981 to 2012 is larger than almost every industry.

Number of hours needed(Avg. Wage) to buy 1 share of the s&p 500
20 hours of work needed in 1970
141 hours needed in 2019.

Growth of Private equity firms
This is where a lot of the worst types of business practices are found. It’s also where a lot of the major corporate bankruptcies occur because they specialize in using debt and leverage to extract as much capital from the business and into their hands. They’re Vultures. It’s no surprise that you’ll find every president and other establishment politicians either connected to one or getting paid hundreds of thousands to give speeches – like Fed chair and soon to be Treasury Secretary Yellen. These crooked business practices are incentivized/rewarded to a much larger degree because of our monetary system and policy.

From 2009-18, Wall Street firms have destroyed 8x as many retail jobs as they have created.
During a period where the overall retail industry added 1 million jobs, hedge funds & private equity firms cut/lost 597,000 retail jobs.

In the 1q of 2019, 70% of retail closures were owned by private equity firms.

The top 25 Hedge Fund managers make an average of 850 million a year – 100% are white men.
The report for the past 3 images can be found here.

Rise of The Big 4 & Fall of The Community Banks
Share of industry assets of big four banks
Unfortunately, this chart from FDIC.gov only goes back to 1984. The big 4 banks(dark blue bar) are Citigroup, Wells Fargo, JP Morgan, and Bank of America. In 1984, the big 4 held 6% of all industry assets, by 2008 they held nearly 50%. Ironically, the largest growth occurred during the Financial Crisis.
Ain’t that a hoot.

Distribution of uS assets by bank size
This chart shows the growth of assets in banks have almost exclusively gone to Giant Banks(>15bil assets).

Disparity in average size of community and non community banks
Community Banks are necessary for small business success. They are able to build relationships and extend loans to borrowers unlikely to receive capital at larger banks.

This is an extension from the chart above. From 1984-2009 the difference in average assets went from 12x to 53x. By the second quarter of 2019 it expanded to 82x.

Commercial Bank Failures
From 1950-1989 the average number of banks ranged from 13,295 to 14,102. Thereafter the number has been on a steady decline. The decline from the 80s into the 90s is in large part to the S&L crisis*. Yet the rapid declines continue.

Extrapolating data from the FDIC chart above—the number of commercial banks stayed level for over 5 decades.

Commercial Banks with assets under 100 million
ThIs is another reason small businesses are being eliminated and big corporations are succeeding – small banks provide more credit and loans to small businesses and people within their community.


BIG 4 BANKS DEPOSITS
& PROFITS & LOANS
The Big 4 Banks (Citigroup, JPMORGAN, Bank of America, Wells Fargo)continue to grow deposits. However, lending is not following the same course…

Lending has stayed relatively flat since 2010. – I touched on this here.

Non Interest Income
From 2012-19 income from trading, venture capital, and investment banking has increased by 5.8% at non community banks.

Credit Card Loans By Bank Size
Credit card loans have been consumed by the large & giant banks. Unfortunately, as interest rates have steadily declined since 1984 CC rates have remained level.

Derivatives Holdings Of The Big Four Banks
The Big Four(Orange) hold 155 TRILLION of derivatives! All of the other banks hold 24 Trillion.

Wages, Wealth, and Income
Wages % of GDP
In decline for the past 50 years. Why in the years before 1970 had it trended flat in between a few percent?

Distribution of Family Wealth
Description for this block. Use this space for describing your block. Any text will do. Description for this block. You can use this space for describing your block.

Cumulative
Pre-tax US Income Growth
Income growth from 46-1980 was around the same for every income group besides the very top, which had less! Quite the turnaround would occur after 1980.

Productivity & Hourly Compensation
This chart depicts an obvious underlying problem within the U.S. economy. If the problem is Capitalism, as most people seem to suggest, why did it occur at this time?

Personal Savings Rate
The personal savings rate for Americans peaked in the 70s around 15% and hit a low just under 2.5% in 2005. After the housing crisis it has rebounded and during the pandemic it has moved much higher – Americans have recently paid down credit card debt at a record pace.

Savings rate from 1947.

Household Debt
Again, the pace of debt gains momentum after 1970 but the housing bubble caused it to go parabolic. Fortunately, the average American would only lose their home while they lowered their debt burden. Too big to fail financial institutions were finally addressed as they were all forced to become much much bigger – “Capitalism”
