Due to eviction moratoriums and forbearance, millions didn’t pay for two big services: rent and interest. How spending got skewed in bizarre ways.
Before taking inflation into account, personal income from all sources – from wages, interest, dividends, rental income, transfer payments such as unemployment compensation, stimulus checks, and Social Security benefits, etc. – rose by 0.2% in August from July.
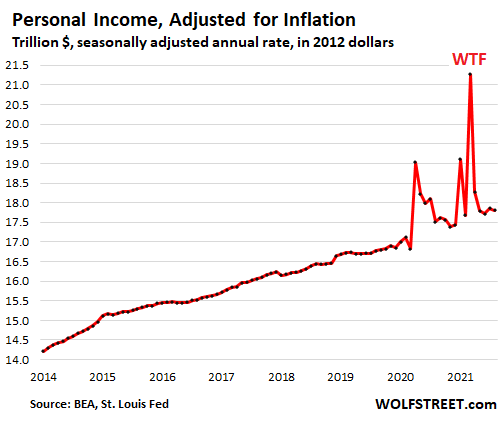
But after taking inflation into account, it’s uglier: Inflation-adjusted – or “real” – personal income fell by 0.2% in August from July, to an annual rate of $17.8 trillion (in 2012 dollars), according to the Bureau of Economic Analysis on Friday.
The spikes in the chart were produced by the three waves of stimulus payments and other piles of funds that were handed out by the government; they created the biggest distortions in consumer income and spending ever. What’s now left behind is the worst bout of inflation in 30 years, that is eating into income:
“Real” personal income without transfer payments fell by 0.3% in August and fell below the pre-pandemic level of February 2020, to an annual rate of $14.17 trillion (in 2012 dollars).
This is personal income from labor, interest, dividends, rental property, etc. but without transfer payments from the government, such as unemployment benefits, stimulus checks, Social Security benefits, welfare benefits, etc.
It should have grown as more people got jobs, and wages increased for many jobs. The green line shows the pre-pandemic trend. It’s tough getting beaten up by the worst bout of inflation in 30 years:
![]()
On the spending front:
- Consumers still spent heroic amounts on goods, but inflation is taking a serious bite out of their “real” spending.
- “Real” spending on durable goods continues to drop from the stimmie-spike, largely due to auto sales, which plunged in recent months due to the collapse in auto inventories.
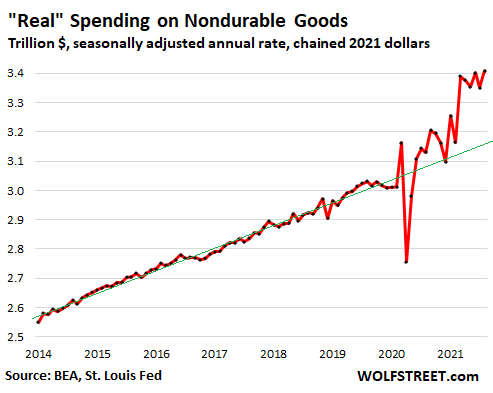
- “Real” spending on nondurable goods ticked up to a record of dizzying magnitude, still powered by working from home, which shifted spending to the supermarket.
- “Real” spending on services was well below pre-pandemic levels, in part perhaps due to eviction moratoriums and mortgage forbearance; rents and the interest on loans are part of spending on services.
Before inflation, consumer spending jumped 0.8% for the month to an annual rate of $15.9 trillion.
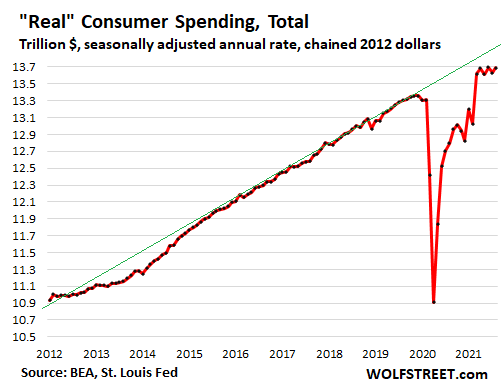
After inflation, consumer spending rose 0.4% for the month, to an annual rate of $14.2 trillion, but only undoing the drop in July, and has remained in the same narrow range since October 2020.
These are still huge amounts that consumers spent, and consumers are still flush with money from the myriad of pandemic-era fiscal and monetary stimulus, from forgivable PPP loans to stock market gains, and they’re still spending bravely. The green line shows the pre-pandemic trend. It’s tough to outspend this type of inflation:
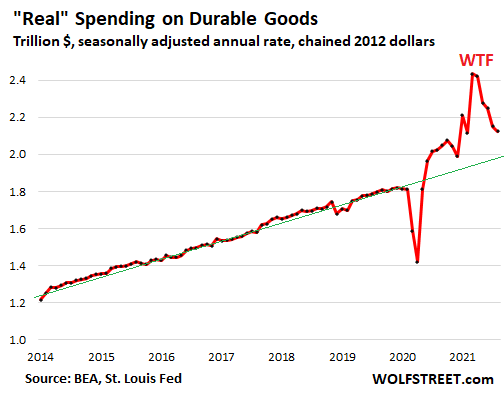
“Real” spending on durable goods dropped another 1.3% in August from July, the fifth month in a row of declines from the breath-taking stimmie-inflated levels in March and April. But spending levels, even after inflation, remain far above the pre-pandemic levels (green line).
A big contributor to the drop in durable goods spending is the plunge in spending on new vehicles in recent months, as inventories on dealer lots have collapsed and there isn’t much left to spend your money on (more in a moment):
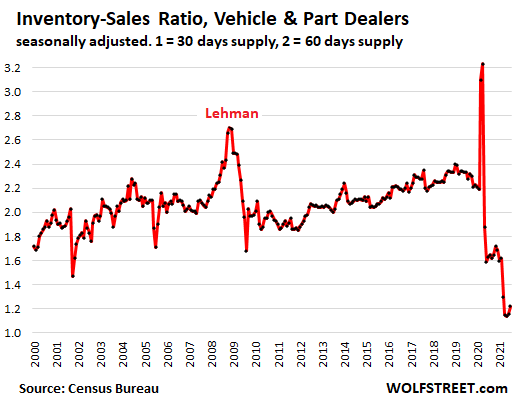
Auto sales normally account for over 20% of total retail sales and dominate spending on durable goods. But new vehicle sales plunged 23% in August compared to August 2019, as dealers ran out of inventory. Auto dealers jacked up their prices in response, and people jostled for position and paid over sticker to score popular trucks and SUVs:
“Real” spending on nondurable goods jumped by 1.7% in August from July to a new record annual rate of $3.41 trillion (in 2012 dollars), a heroically high amount and far above the pre-pandemic trend line (green). This category is dominated by food and energy, including gasoline, but also includes household goods of the type sold in supermarkets that were among the winners of the shift to working from home:
“Real” spending on services ticked up 0.3% for the month but remains 2.2% below February 2020, and far below the pre-pandemic trend line (green). At an annual rate of $8.35 trillion (in 2012 dollars), real spending on services is where it had first been in June 2018.
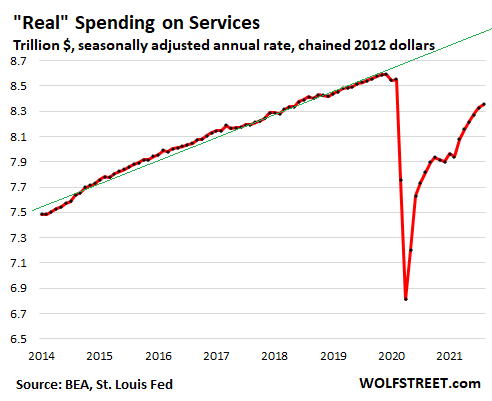
Services accounted for only 61% of total spending in August; before the pandemic, it accounted for about 65% of total spending. During the pandemic, spending shifted from certain types of services (such as travel and entertainment events and healthcare) to goods.
Rents and the interest portion of loan payments also fall into this category of spending on services. Given that the eviction moratoriums were still in place in August, and that 1.6 million mortgages were still in forbearance at the end of August, and that $1.6 trillion in student loans were still in forbearance, part of the decline in spending on services was caused by many consumers not making their rent and loan payments.
This situation with unpaid rents and interest is an example of how the massive and wide-ranging pandemic-era programs have side effects that skew spending in bizarre ways.
Enjoy reading WOLF STREET and want to support it? Using ad blockers – I totally get why – but want to support the site? You can donate. I appreciate it immensely. Click on the beer and iced-tea mug to find out how:

Would you like to be notified via email when WOLF STREET publishes a new article? Sign up here.

Metal roofs are a great defense against wildfires. Click here or call 1-800-543-8938 for details from our sponsor, the Classic Metal Roofing folks.

Classic Metal Roofing Systems, the leader in fire safe roofing for residential applications, manufactures products that are 1/20 the weight of most tile products and eligible for Class A, B, or C fire ratings as determined by roof preparation.